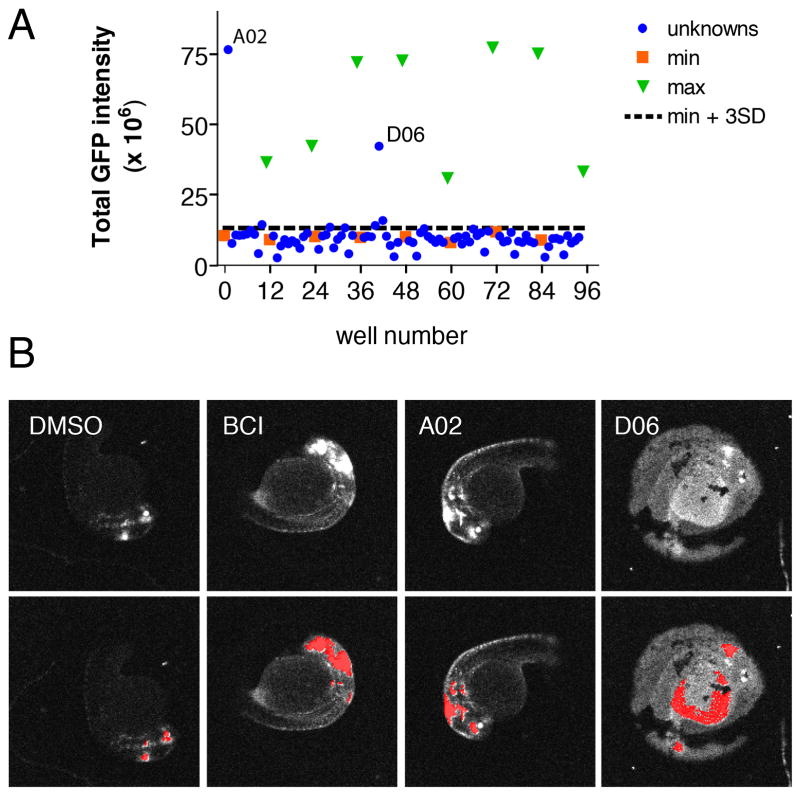
Fig 1.
Automated chemical screen in zebrafish identifies Oxyq as a potential activator of FGF signaling. (A) Graph showing mean GFP intensity from two plates together with the mean + 3 SD limits of the negative control wells (B) Morphology of Tg(dusp6:d2eGFP) embryos in the presence of negative control (DMSO), positive control (BCI) and 8-hydroxyquinoline hemisulfate (A02). Well D06 illustrates the appearance of a fluorescent yolk that is not the site of FGF activity and this “hit” was eliminated. Upper panels show original scan images; lower panels show images with CNT analysis applied.

