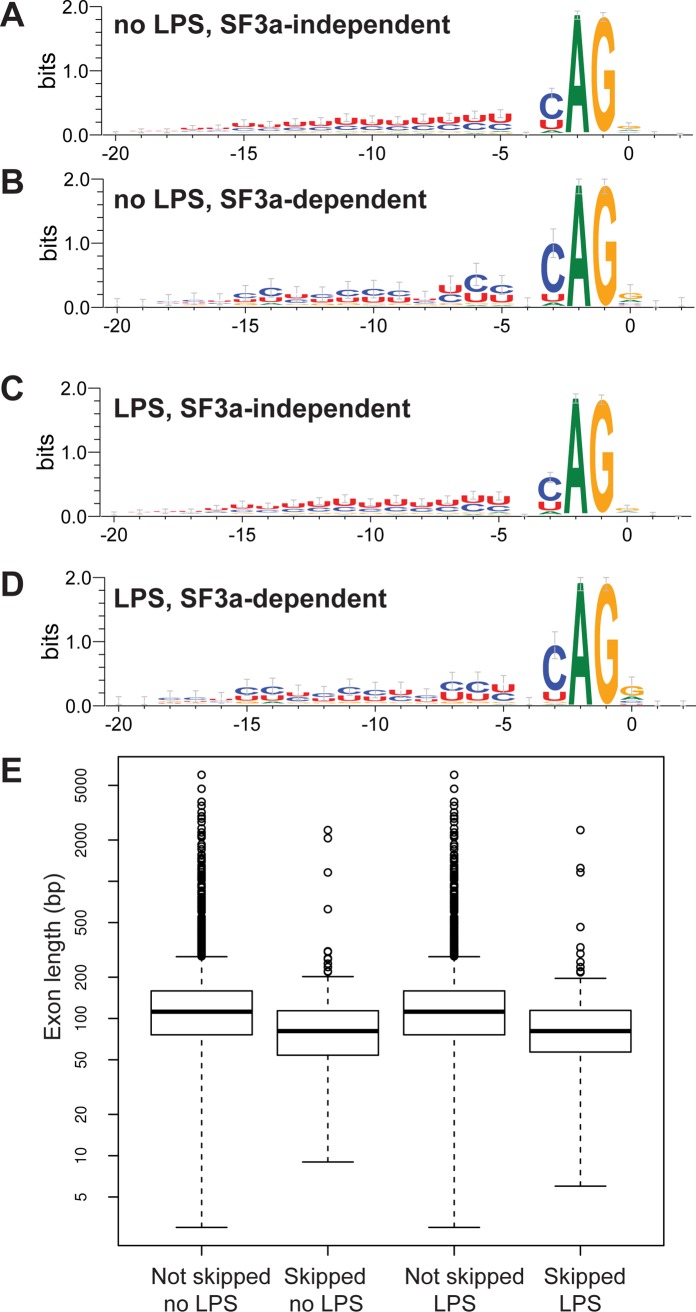
Figure 3. Identification of intron and exon features that correlate with alternative splicing events regulated by SF3a1.
(A-D) Sequence logo plots of the polypyrimidine tracts and 3’ splice site of introns that are retained when SF3a1 is inhibited (SF3a-dependent) or introns that are spliced out correctly when SF3a1 is inhibited (SF3a-independent, or at least less dependent) in the RAW264.7 cell line. (E) The length of exons that are skipped when SF3a1 is inhibited compared to those exons that are not skipped. The boxplots were generated using default conventions in R 3.0.1. The boxes show the interquartile range, the whiskers the most extreme data point that is no more than 1.5 times the interquartile range from the box. Exon lengths are depicted on a log scale. “Skipped” refers to exons with increased rate of skipping when SF3a1 is inhibited, whereas “not skipped” refers to exons that have the same rate of skipping, regardless of SF3a1 levels.

