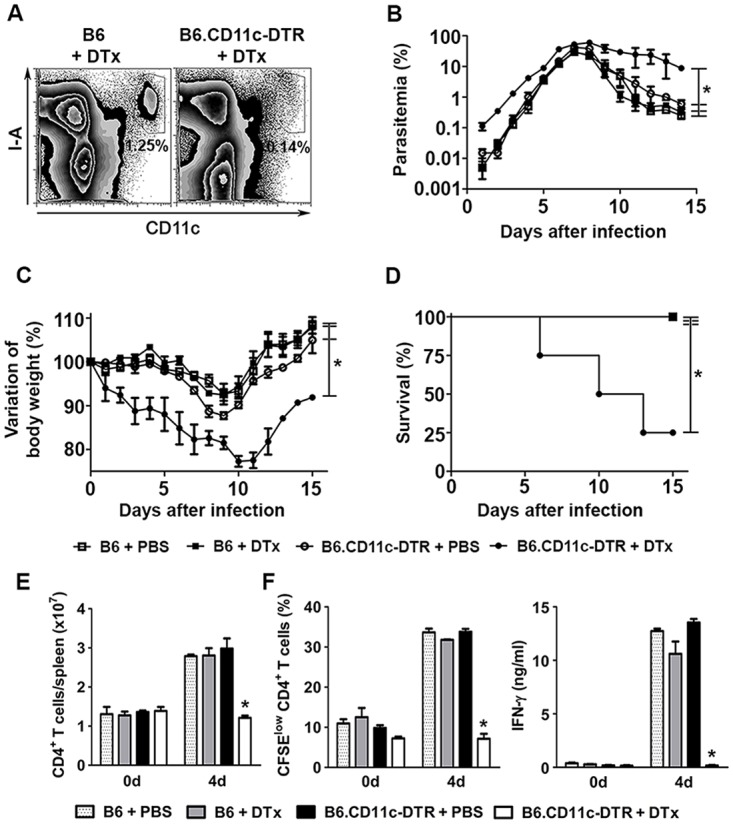
Figure 1. Effects of DC depletion on acute Pc malaria.

(A-F) B6 and B6.CD11c-DTR mice were treated with either DTx to deplete CD11c+ cells or PBS as a control. The mice were i.p. infected with 1 × 10⁶ Pc iRBCs 24 h later. (A) Representative contour plots obtained 24 h after treatment by flow cytometry confirm the efficiency of DTx-induced depletion of splenic CD11c+I-A+ cells in B6.CD11c-DTR mice. Data show the percentages of CD11c+I-A+ cells in the splenocyte population. (B) Parasitemia curves are shown (means ± SD). (C) Variations in body weight relative to day 0 are shown (means ± SD). (D) Survival curves are shown. (E) Data show the numbers of CD3+CD4+ T cells per spleen at days 0 and 4 p.i. (means ± SD). (F) Data show the percentages of proliferating CFSElowCD4+ T cells and IFN-γ concentrations in the supernatants of spleen cell cultures stimulated for 72 h with iRBCs (means ± SD). In B-D, significant differences (p < 0.05) between the indicated groups are designated by *. In E and F, significant differences (p < 0.05) between all other groups are designated by *. In A-F, one representative experiment out of three (n = 5) is shown.
