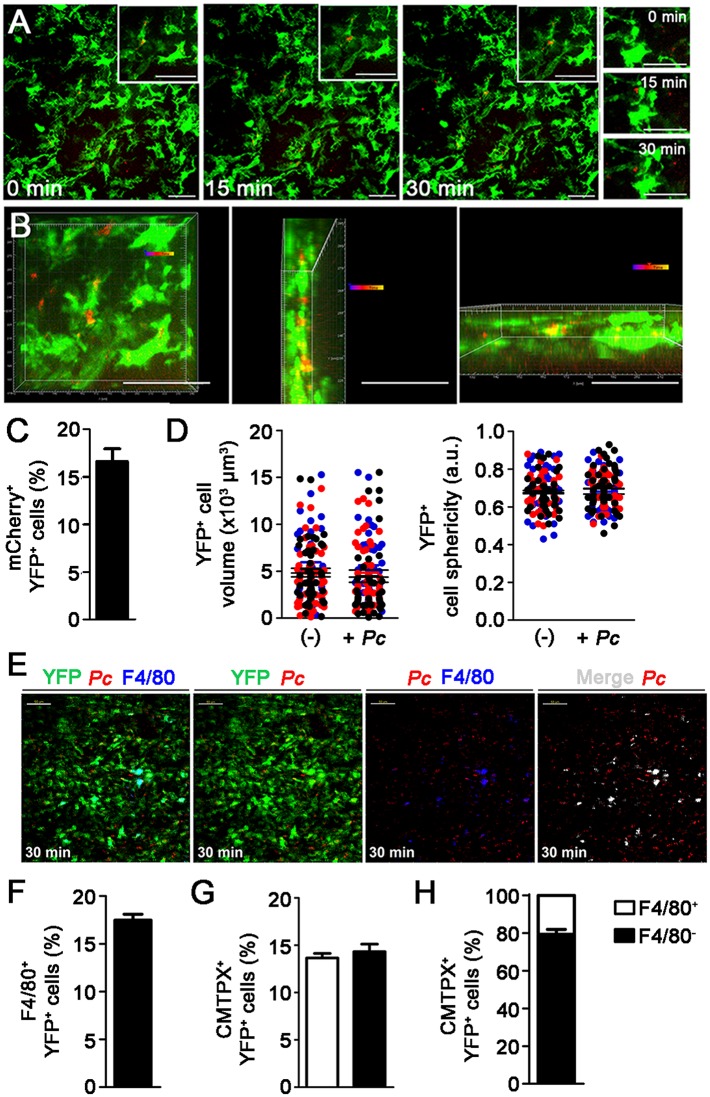
Figure 2. In vivo analysis of iRBC uptake by subcapsular RP DCs soon after Pc infection.
(A-D) B6.CD11c-YFP mice were i.v. infected with 1 × 10⁸ mature mCherry-Pc iRBCs. Spleens were analyzed by CIVM after 15 min and in non-infected controls. (A) Serial snapshots taken at 15 min p.i. (0 min) show the subcapsular RP. The upper panels show the amplification of a few cells co-expressing YFP (green) and mCherry (red). In the image on the right, a region showing contact between YFP+ cells and mCherry-Pc iRBCs is magnified. (B) CIVM 3D animation reveals that YFP+ cells contain mCherry-Pc iRBC remnants (yellow spots of merged mCherry/YFP-3D signal). (C) Percentage of mCherry+ cells in the YFP+ cell population is shown (mean ± SEM). (D) YFP+ cell volume and sphericity are shown for naïve mice (-) and recently infected mice (+Pc). Black, red and blue dots are from three different experiments. Horizontal lines represent mean values and SEM. (E-H) B6.CD11c-YFP mice were i.v. infected with 1 × 10⁸ mature CMTPX-Pc iRBCs. After 15 min, mice were injected i.v. with a fluorescent anti-F4/80 mAb and the spleens were analyzed by CIVM. (E) Snapshots taken 30 min later show YFP+ cells (green), iRBCs (red), F4/80+ cells (blue) and merged F4/80+YFP+ cells (white) in the subcapsular RP. (F) Percentage of F4/80+ cells in the YFP+ cell population is shown (mean ± SEM). (G) Percentages of CMTPX+ cells in the F4/80+YFP+ and F4/80-YFP+ cell subsets are shown (means ± SEM). (H) The relative proportions of F4/80+ and F4/80- cells in the CMTPX+YFP+ cell population were calculated from the data obtained in F and G (means ± SEM). In A, B and E, the scale bars correspond to 50 µm. One representative experiment out of three (n = 2) is shown. In C, D, F, G and H, data were calculated using Imaris software. Data from three experiments (n = 2) are shown.

