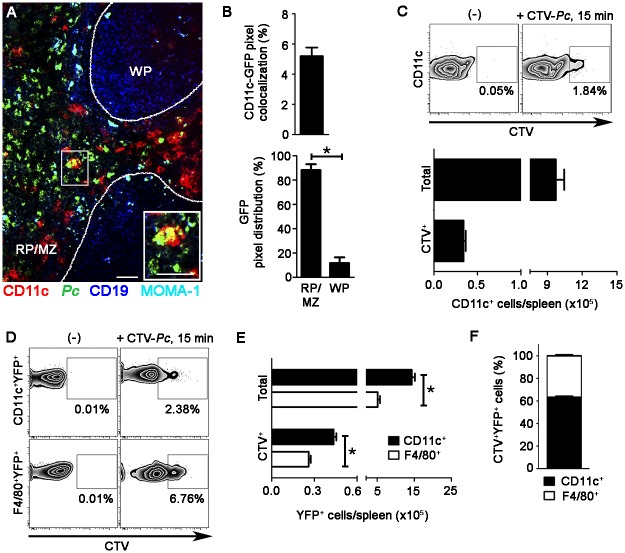
Figure 3. Ex vivo analysis of iRBC uptake by splenic DCs soon after Pc infection.
(A-C) B6 mice were i.v. infected with 1 × 10⁸ purified mature CTV-Pc iRBCs (flow cytometry) or GFP-Pc iRBCs (immunofluorescence). Spleens were analyzed after 15 min and in non-infected controls. (A) A representative immunofluorescence image (10x magnification) shows the spleen of an infected B6 mouse. The staining of MOMA-1+ metallophilic macrophages and CD19+ B cells delineates the RP/MZ from the white pulp (WP). The lower panel details a merged GFP+CD11c+ cell in the RP. (B) Percentage of CD11c pixels colocalized with GFP pixels and percentages of GFP pixel distribution in the splenic RP/MZ and WP were obtained from immunofluorescence images (means ± SD). (C) Representative contour plots obtained by flow cytometry show CTV staining in the CD11c+ cells of naïve mice (-) and recently infected mice. CD11c+ cells in the CD3-CD19-DX5-Ter119- cell population were analyzed, while excluding T cells, B cells, NK cells and RBCs. Data in contour plots show the percentages of CTV+ cells in the CD11c+ cell population. The numbers of total and CTV+CD11c+ cells per spleen in recently infected mice were calculated from the data obtained in contour plots (means ± SD). (D-F) B6.CD11c-YFP mice were i.v. infected with 1 × 10⁸ purified mature CTV-Pc iRBCs. Spleens were analyzed by flow cytometry after 15 min and in non-infected controls. (D) Representative contour plots show CTV staining in the CD11c+YFP+ and F4/80+YFP+ cells. Data show the percentages of CTV+ cells in each population. (E) The numbers of total and CTV+ CD11c+YFP+ and F4/80+YFP+ cells per spleen were calculated from the data obtained in D (means ± SD). (F) The relative proportions of CD11c+ and F4/80+ cells in the CTV+YFP+ cell population were calculated from the data obtained in E (means ± SD). In A, the scale bars correspond to 50 µm. In B, data were calculated using FIJI software. In B and E, significant differences (p < 0.05) between the indicated groups are designated by *. In A-F, one representative experiment out of three (n = 3-4) is shown.

