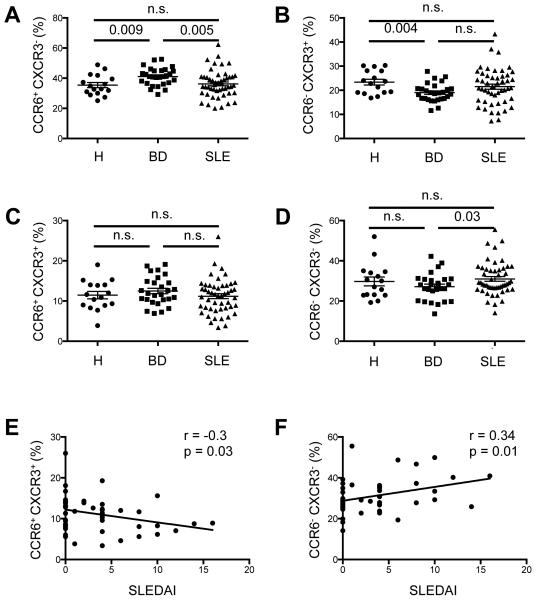
Figure 4. Analysis of CXCR5hi Th-cell subsets and correlation with SLEDAI.
A-D, Percentage of CCR6+CXCR3−(A), CCR6−CXCR3+ (B), CCR6+CXCR3+ (C), and CCR6− CXCR3−(D) cells among the circulating CD45RA−CXCR5hi CD4+ population in SLE patients (n = 49), in comparison to healthy controls (H; n = 16) and BD (n = 28) patients. (Student’s t-test, n.s. = non significant). Horizontal lines represent the mean values with standard error of the mean. E and F, Correlation between percentage of CCR6+CXCR3+ (E), and CCR6−CXCR3−(F) cells among circulating, activated CD45RA−CXCR5hi CD4+ cells and SLEDAI (E, Spearman r = −0.3, p = 0.03; F, Spearman r = 0.34, p = 0.01). Data points represent individual subjects.

