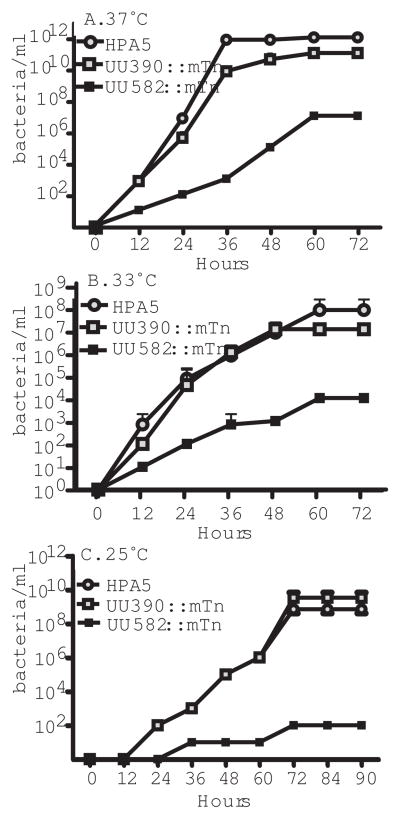
Figure 5.
Growth kinetics for U. parvum parent strain (HPA5) compared to membrane protein disruption (UU390::mTn) or DEADbox RNA-helicase gene disruption (UU582::mTn) when incubated at 37°C (A.), 33°C (B.), or 25°C (C.). Strains were titrated out in a 10-fold dilution series and growth measured at time points indicated by urease conversion of urea to ammonium ions. Ureaplasma growth is shown as colour (pH indicator) changing units per ml. Mean and standard deviation of dilutions performed in triplicate. Results were consistent through three repeated experiments.

