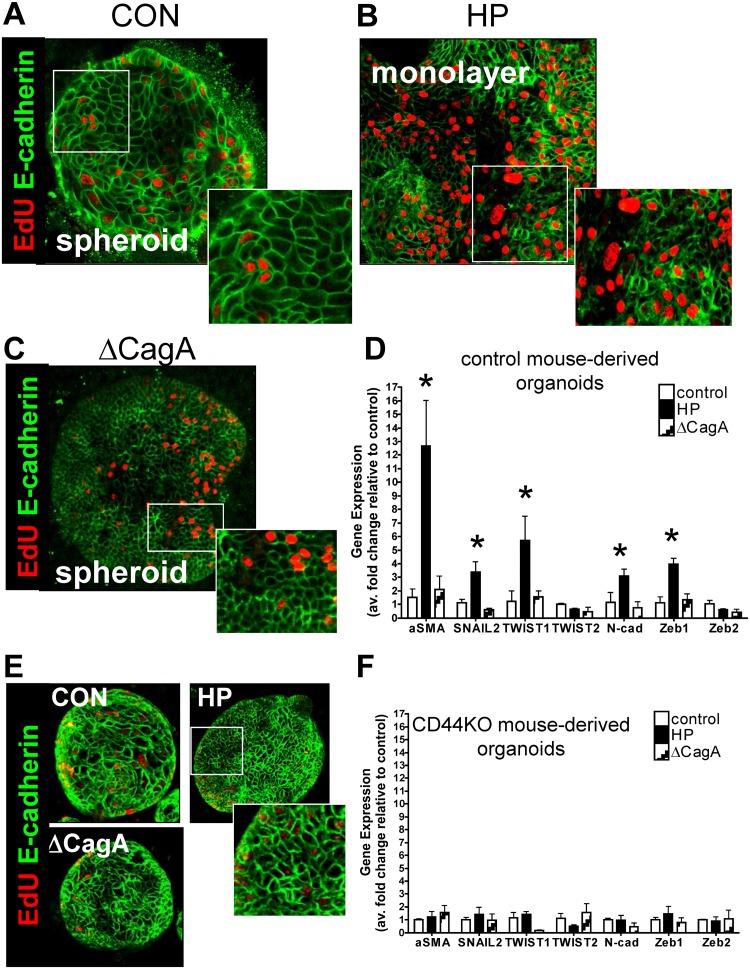
Fig 4. H. pylori-induced epithelial-to-mesenchymal transition (EMT).
Immunofluorescence of EdU (red) and E-cadherin (green) using (A) uninfected control (CON), (B) H. pylori (HP) or (C) ∆CagA infected mFGOs. (D) EMT marker (αSMA, SNAIL, TWIST, N-cadherin and Zeb) expression measured by qRT-PCR using RNA isolated from mFGOs uninfected (control), H. pylori (HP) or ∆CagA infected. *P<0.05 compared to CON group, n = 4 individual experiments/group. (E) Immunofluorescence of EdU (red) and E-cadherin (green) using uninfected control (CON), H. pylori (HP) and ∆CagA infected mFGOs derived from stomachs of CD44-deficient mice. (F) (D) EMT marker (αSMA, SNAIL, TWIST, N-cadherin and Zeb) expression measured by qRT-PCR using RNA isolated from mFGOs derived from CD44-deficient mouse stomachs uninfected (control), H. pylori (HP) or ∆CagA infected.

