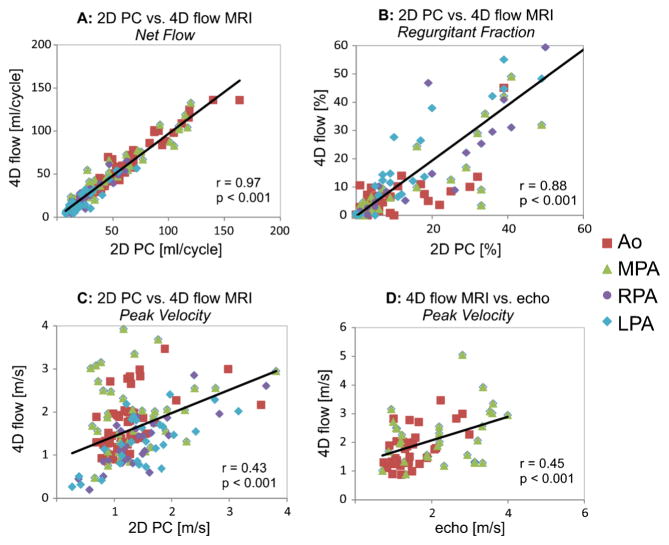
Fig. 3.
Graphs show correlation of aortic and pulmonary flow parameters between 4-D flow and 2-D phase-contrast (PC) MRI. Correlations are for net flow (a), regurgitant fraction (b) and peak systolic velocities (c). In addition, correlation analysis was performed for peak systolic velocities obtained by echo and 4-D flow (d). c, d Volumetric 4-D flow analysis was based on peak systolic velocities in the aortic root/ascending aorta and MPA. Ao aorta, LPA left pulmonary artery, MPA main pulmonary artery, RPA right pulmonary artery

