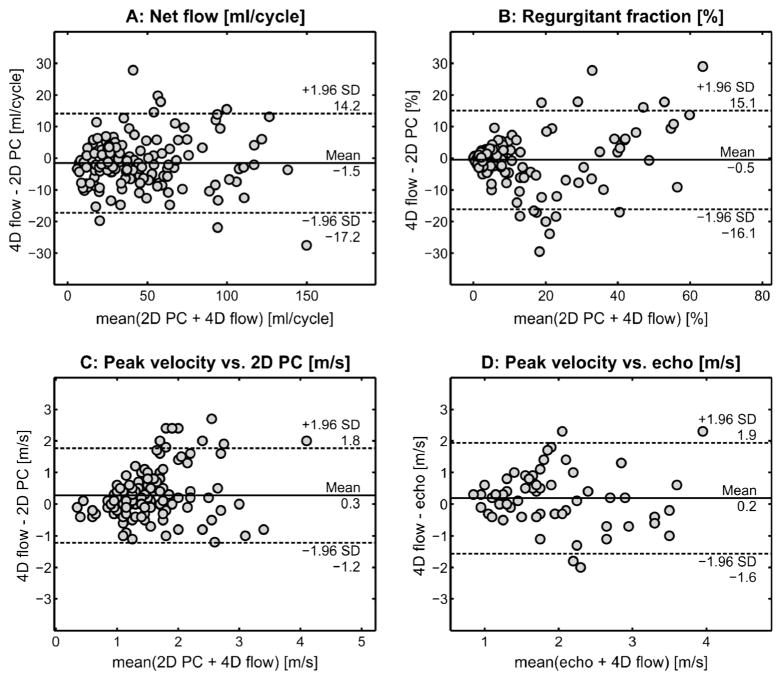
Fig. 4.
Lines of equality and 95% limits of agreement of aortic and pulmonary flow parameters. Bland-Altman plots show the lines of equality between and 95% limits of agreement between 2-D phase-contrast (PC) MRI and 4-D flow for net flow (a) and regurgitant fraction in the aorta, MPA, RPA and LPA (b), 2-D phase-contrast MRI planar and 4-D flow volumetric peak systolic velocities for the aorta and MPA (c), and peak systolic velocities obtained by echo and volumetric 4-D flow in the aorta and MPA (d). LPA left pulmonary artery, MPA main pulmonary artery, RPA right pulmonary artery

