
Figure 3.
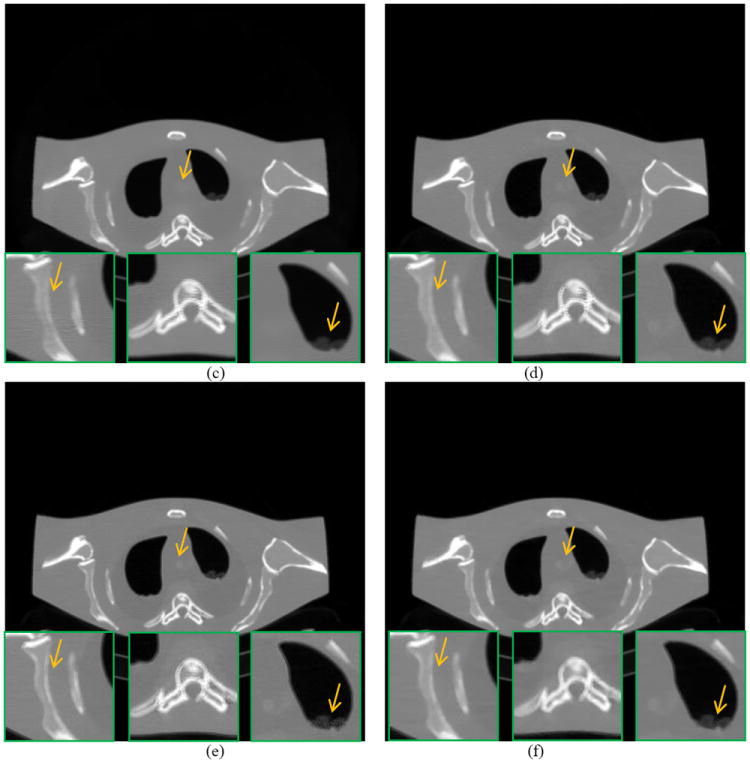
A reconstructed slice of the anthropomorphic torso phantom: (a) FBP reconstruction from the averaged sinogram; (b) FBP reconstruction from the 40mAs sinogram; (c) FBP+NLM filtering from the 40mAs sinogram (h=0.012); (d) PWLS-NLM reconstruction from the 40mAs sinogram (β=3×10⁵, h=0.008); (e) PWLS-adaptiveNLM reconstruction from the 40mAs sinogram (β=3×10⁵, s=5×10⁻⁴, t=4×10⁻⁶); (f) PWLS-TV reconstruction from the 40mAs sinogram (β=200). All the images are displayed with the same window.