
Figure 5. Kif18agcd2 mutant MEFs exhibit chromosome alignment defects.
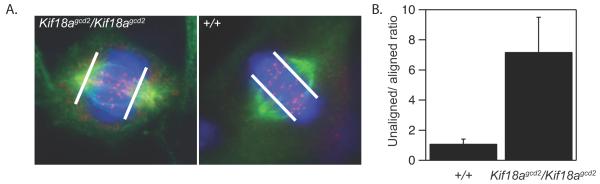
Mitotic profiling of Kif18agcd2 mutant MEFs immunolabeled for tubulin (green) and CREST (red, centromeres) (A) revealed a high ratio of preanaphase mitotic cells with unaligned versus aligned chromosomes in mutant MEFs compared to wild type controls, n=3 cell lines per genotype, mean +/− s.d. is displayed (B).