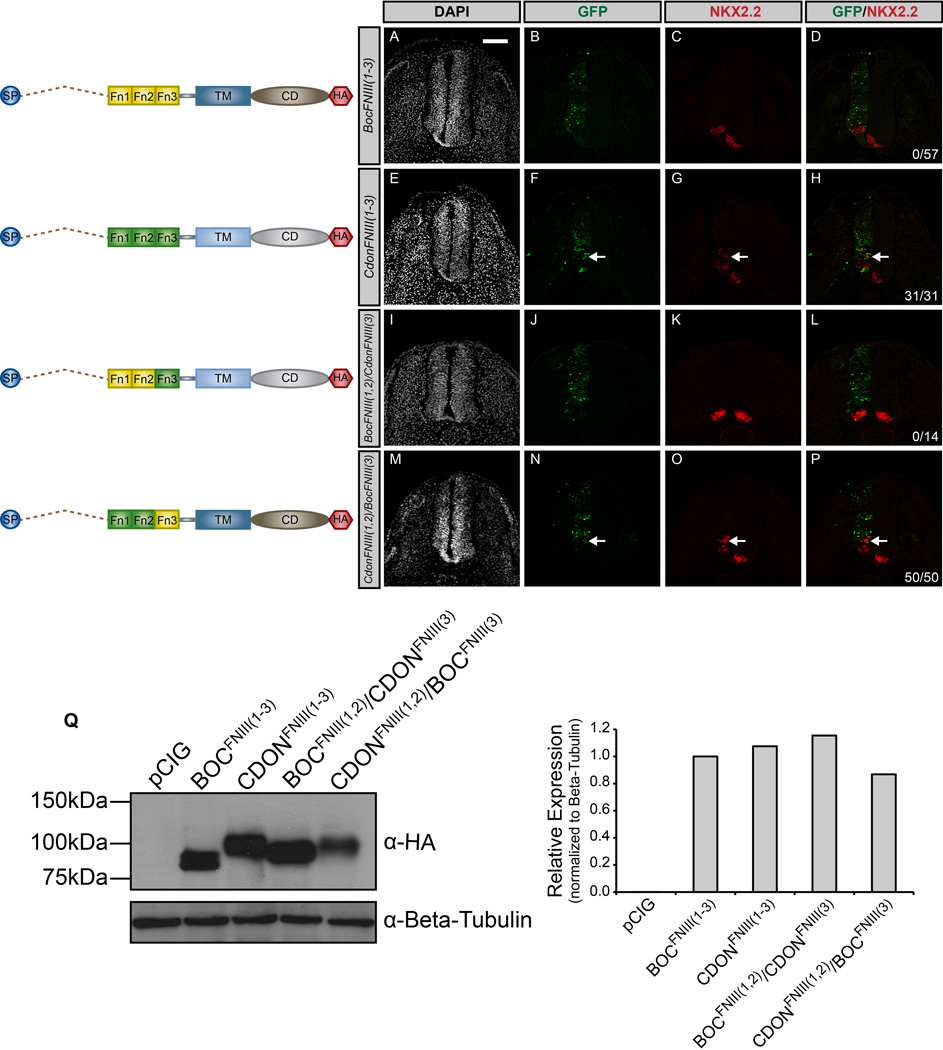
Figure 6. Chimeric constructs reveal functional differences between the FNIII domains of CDON and BOC.
(A–P) Forelimb level transverse sections of Hamburger-Hamilton stage 21–22 chicken neural tubes electroporated with BocFNIII(1–3) (A–D), CdonFNIII(1–3) (E–H), BocFNIII(1,2)/CdonFNIII(3) (I–L), and CdonFNIII(1,2)/BocFNIII(3) (M–P) stained with anti-NKX2.2 antibody (red). Green (GFP+) cells depict electroporated cells and nuclei are identified by DAPI (grayscale). Merged images are shown on the right, including quantitation of the number of embryos that display ectopic NKX2.2 expression (denoted by arrows). Scale bar, 10µm. (Q) Western Blot Analysis of COS-7 cell lysates following transfection with the specified constructs and probed with anti-HA antibody and anti-Beta-tubulin as a loading control (left panel). ImageJ quantitation of relative expression levels is expressed as a histogram (right panel).

