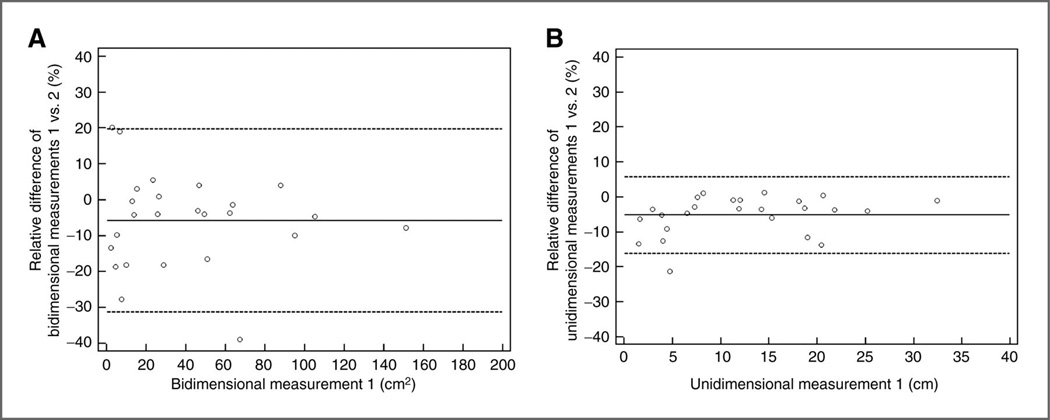
Fig. 6.
Interobserver variability of bidimensional and unidimensional measurements. (Reprinted with permission from Ref. 18: Clin Cancer Res. 2013;19:3936-43.)
Bland–Altman plots show interobserver variability of bidimensional and unidimensional measurements on baseline scans in 25 patients. The 95% limits of agreement of bidimensional measurements were (−31.3%, 19.7%; A, dashed lines), that were twice wider compared with those of unidimensional measurements (−16.1%, 5.8%; B, dashed lines). The dotted lines represent the mean relative difference (%).

