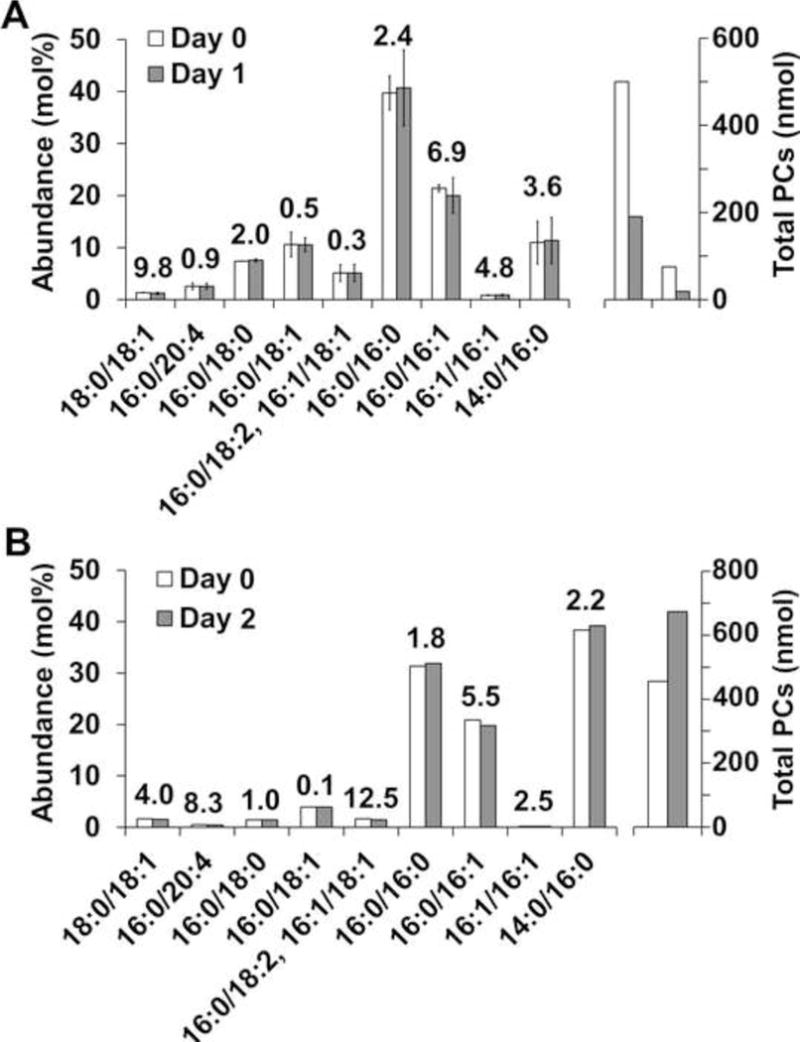
Figure 2.

Stability of PC composition regarding postmortem sampling time. The abundance (left axis) of specific PC species in A) dog (n=2) and B) a California sea lion (n=1) is shown for samples collected immediately after death (day 0) or one or two days following death. There were no significant differences (p > 0.05) between day 0 and day 1 PC species for dog (error bars represent standard deviation of the mean, n=2). The number above each bar represents the percent difference between time points. The right axis shows the total PCs extracted from 1 Ml aliquots of the reconstituted surfactant samples; differences between total amounts are discussed in the results.
