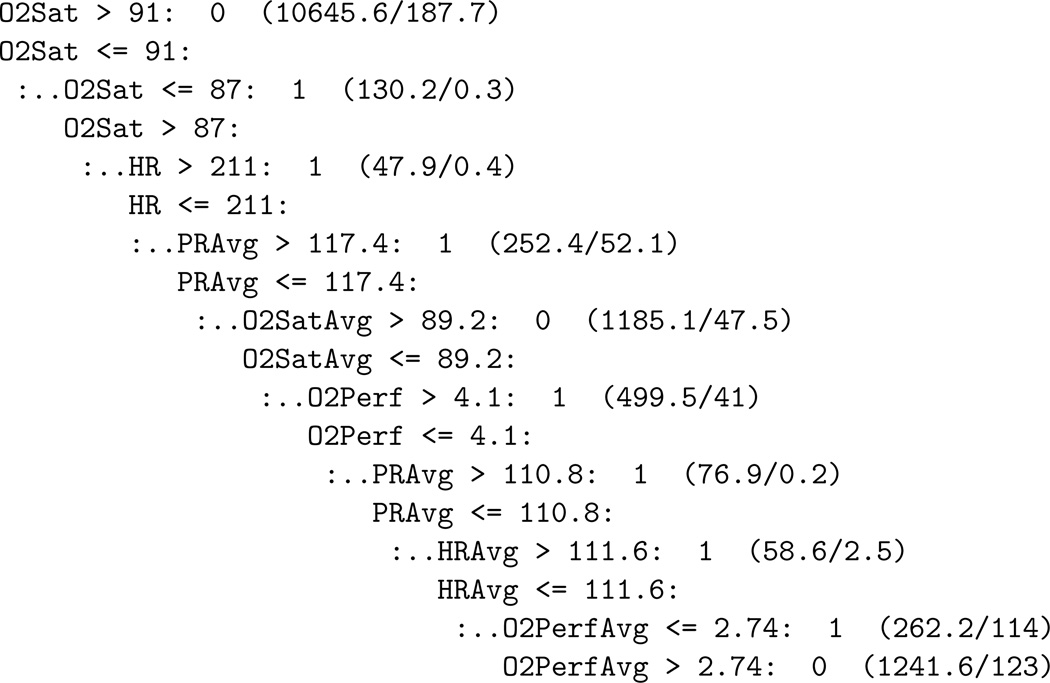
Figure 2.
An example classification tree. This asymmetric tree encodes a succession of decision criteria, where each condition leads either to a classification (0/stable or 1/alarm) or to a subsequent threshold test. For example, according to this tree, if the patient’s O2Sat exceeds 91, that is considered stable. If it is below 87, that is considered an alarm condition. In-between, we need to examine the heart rate, which, if above 211, means alarm. Otherwise, we continue to apply further threshold tests until we reach a classification. The numbers in parentheses show the total number of training instances that fell into this region of the hyperspace and the number of these that were misclassified. These counts are not generally integers and the number of misclassifications is not zero because of See5’s pruning methods, which try to avoid overfitting. This tree had the smallest training error among a community of classifiers that were built on 14,400 training data points (from 4 monitoring hours) with 10 trials of boosting. Reproduced with permission from [20]. Copyright @ 2007 IEEE.

