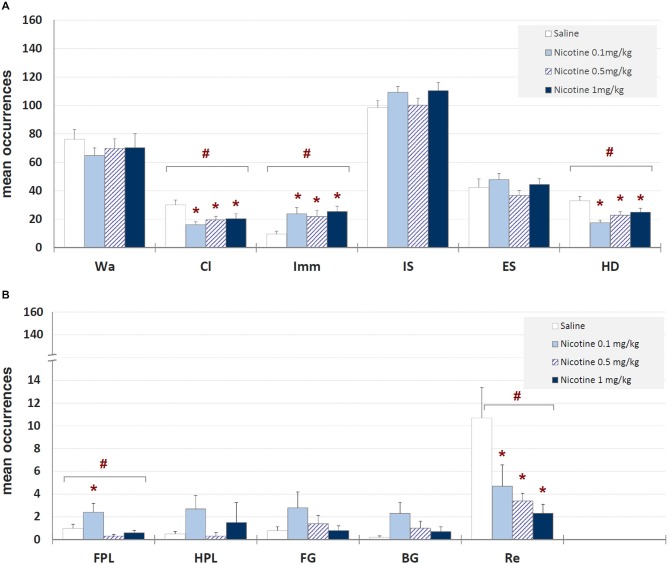
Figure 4.
Mean occurrences ± SEM of behavioral components in unlesioned groups (saline, nicotine 0.1, 0.5, and 1 mg/kg). # = significant (p < 0.05) ANOVA result; * = significant (p < 0.05) difference in comparison with saline (Newman-Keuls post hoc test for multiple comparisons). Panel (A) = behavioral components with occurrences ± SEM in one or more groups > 5; panel (B) = behavioral components with occurrences ± SEM in one or more groups < 5. See Figure 2 for abbreviations.

