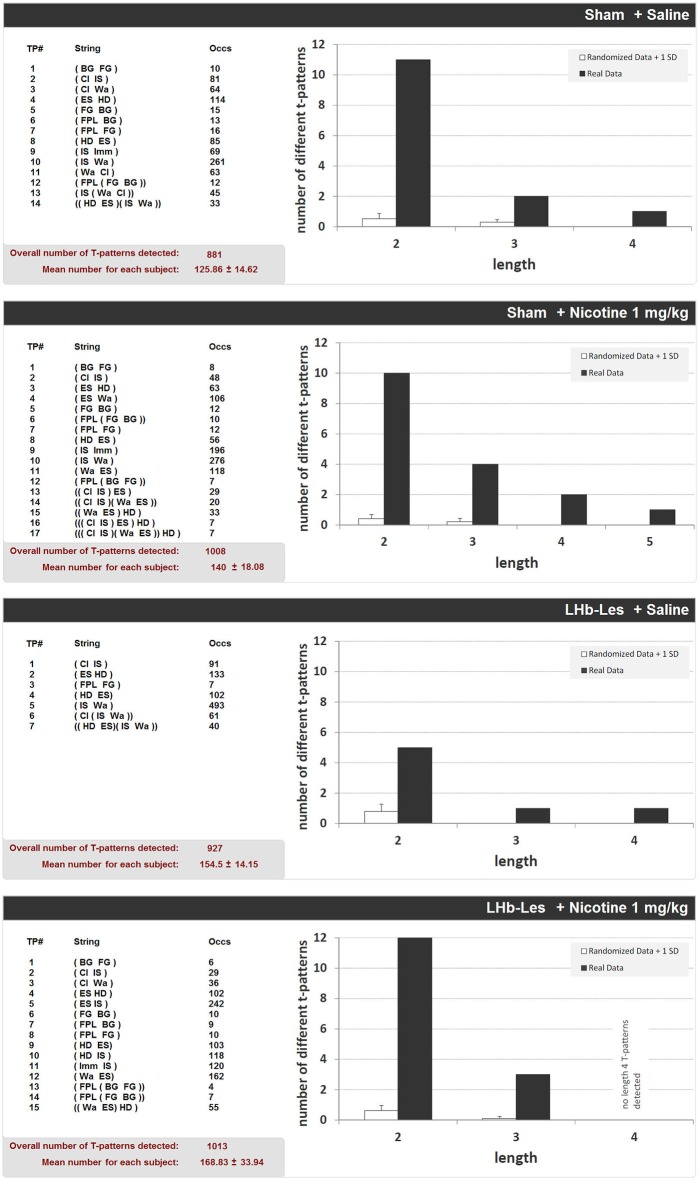
Figure 8.
T-patterns detected in sham-lesioned groups (sham + saline and sham + nicotine 1 mg/kg) and in LHb-lesioned groups (LHb-les + saline and LHb-les + nicotine 1 mg/kg). “TP#” column: number of each different T-pattern detected; “String” column: events encompassed in T-pattern’s structure; “Occs” column: occurrences of each T-pattern. Histograms: T-patterns length distribution in real data (dark bars) and random generated data + 1 SD (white bars). Bottom left of each panel: overall T-patterns detected in the group and mean number of T-patterns for each subject. See Figure 2 for abbreviations.

