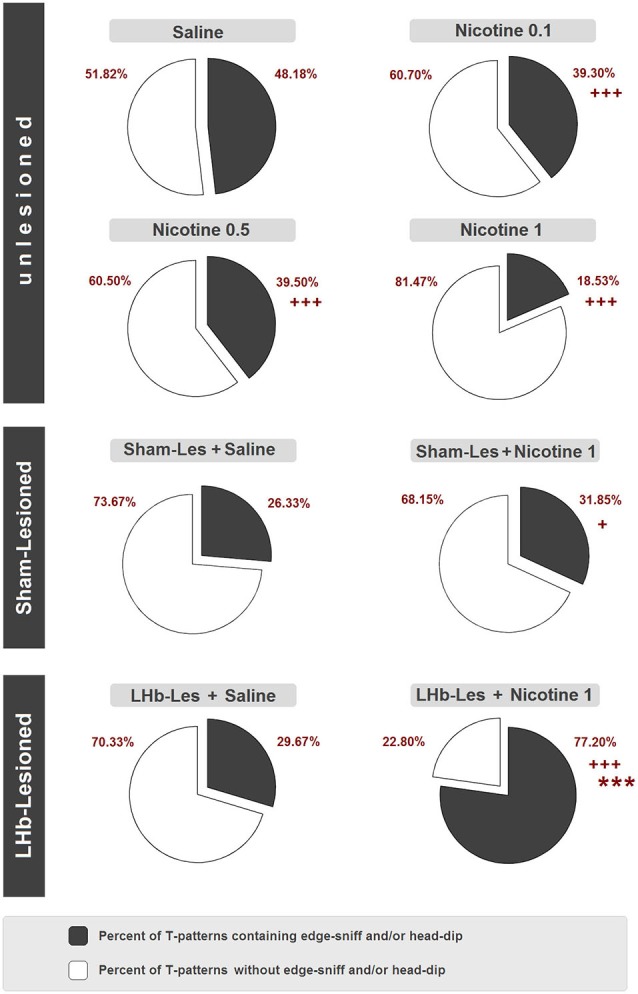
Figure 9.

Percent distribution of T-patterns containing edge-sniff and/or head dip in unlesioned groups (saline, nicotine 0.1, nicotine 0.5, and nicotine 1) sham-lesioned groups (sham-les + saline and sham-les + nicotine 1 mg/kg) and in LHb-lesioned groups (LHb-les + saline, LHb-les + nicotine 1). *** = p < 0.0001 compared to the sham-lesioned group after the same drug treatment; + = p < 0.05, ++ = p < 0.005; +++ = p < 0.0001 compared to the same group under saline condition (chi-square test).
