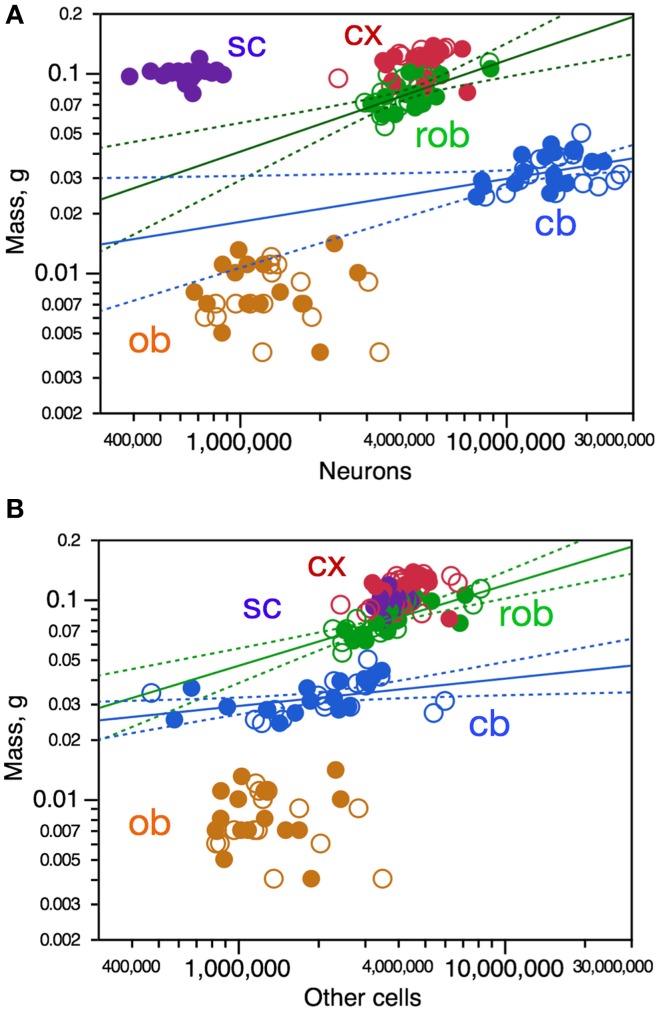
Figure 2.
Variations in CNS structure mass are poorly correlated, if at all, with variation in number of neurons (A) and number of other cells (B) across mouse individuals. Each data point represents one CNS structure in one individual. Values for brain structures refer to right (filled symbols) and left sides (open symbols) separately. Cx, cerebral cortex (gray and white matter combined); cb, cerebellum; ob, olfactory bulb; rob, rest of brain; sc, spinal cord. (A) Spearman correlation coefficients for each structure: cx, ρ = 0.4062, p = 0.0210; rob, ρ = 0.5532, p = 0.0012; cb, ρ = 0.3375, p = 0.0547; ob, ρ = 0.0897, p = 0.6313; sc, ρ = 0.1286, p = 0.5999. Only the power functions with significant exponents are shown: cb, exponent, 0.216 ± 0.096, r2 = 0.140, p = 0.0322; rob, exponent, 0.458 ± 0.109, r2 = 0.380, p = 0.0002; cx, p = 0.2251; ob, p = 0.8675; sc, p = 0.7778. (B) Spearman correlation coefficients for each structure: cx, ρ = 0.3580, p = 0.0443; rob, ρ = 0.7499, p < 0.0001; cb, ρ = 0.5700, p = 0.0005; ob, ρ = 0.0690, p = 0.7122; sc, ρ = 0.3573, p = 0.1332. Only the power functions with significant exponents are shown: cb, exponent, 0.137 ± 0.054, r2 = 0.172, p = 0.0166; rob, exponent, 0.404 ± 0.072, r2 = 0.519, p < 0.0001; cx, p = 0.1228; ob, p = 0.6807; sc, p = 0.1332.

