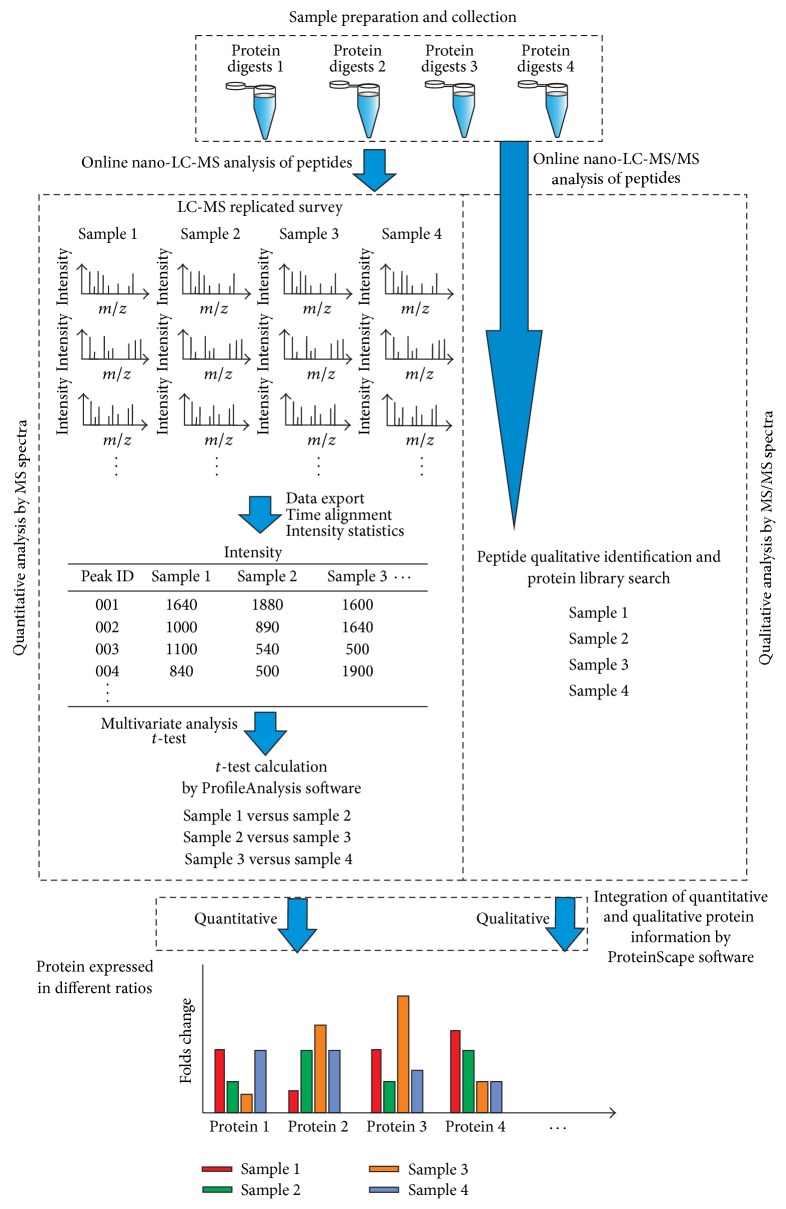
Figure 2.
The flow chart of label-free quantitative proteomics based on extracted ion chromatography. The label-free quantitative proteomics was achieved by the software packages of DataAnalysis, ProfileAnalysis, and ProteinScape from Bruker Daltonics. Each sample group of digested proteins was tested by nano-LC-MS with replicated runs for quantitation of peptide ions. MS/MS spectra were also acquired by nano-LC-MS/MS analysis of these digested samples for protein identification. The intensity and elution time of each peptide ions were recorded as a quantitative “molecular feature.” These molecular feature ions acquired from different nano-LC-MS runs were aligned according to their accurate masses and reproducible LC retention time. Peptide peaks with expression ratios between two sample groups were calculated with t-test method in ProfileAnalysis. Theset-test results were further transferred to ProteinScape and combined with their protein identification results for integrating both quantitative and qualitative information of each protein in all sample groups.

