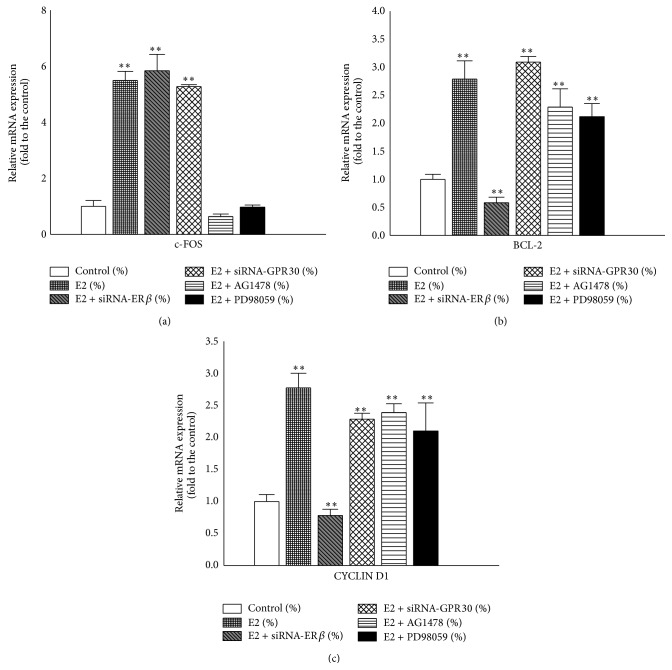
Figure 4.
Relative expression levels of genes in T24 cells after treatment with E2. ((a)–(c)) Cells were pretreated as described in Figure 3(a) and then incubated with 10 nM E2 for 48 h. Total RNA was extracted for qPCR. c-FOS, BCL-2, and CYCLIN D1 mRNA expression levels were evaluated and normalized to β-actin level. The values represent the mean ± SD of the data from three independent experiments. ∗∗ P < 0.01.

