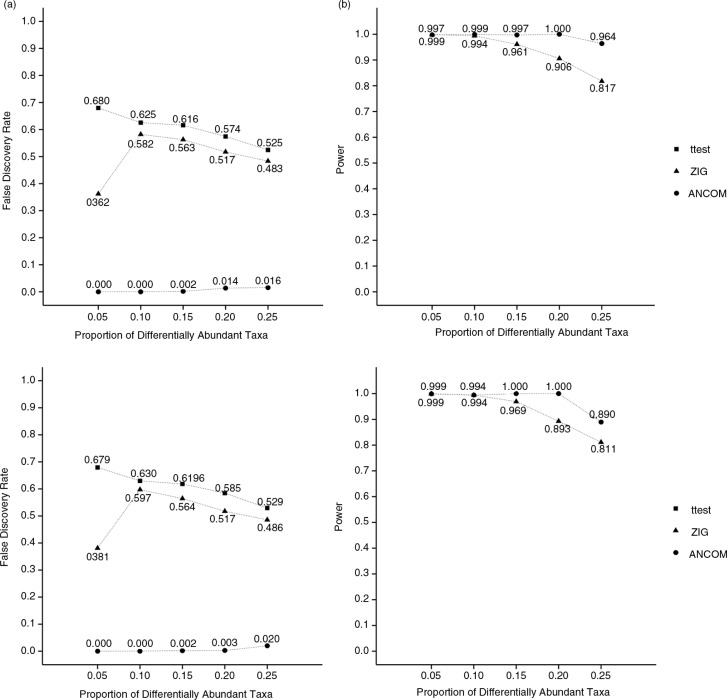
Fig. 2.
Comparison of (a) false discovery rate and (b) statistical power to detect differentially abundant microbial taxa by t-test, ZIG, and analysis of composition of microbiomes, based on 100 simulated data sets consisting of 500 (top panels) and 1,000 (bottom panels) taxa. Value of π ranges from 0.05 to 0.25. Power for the t-test is unity over the entire range of π and is not shown on the plots.

