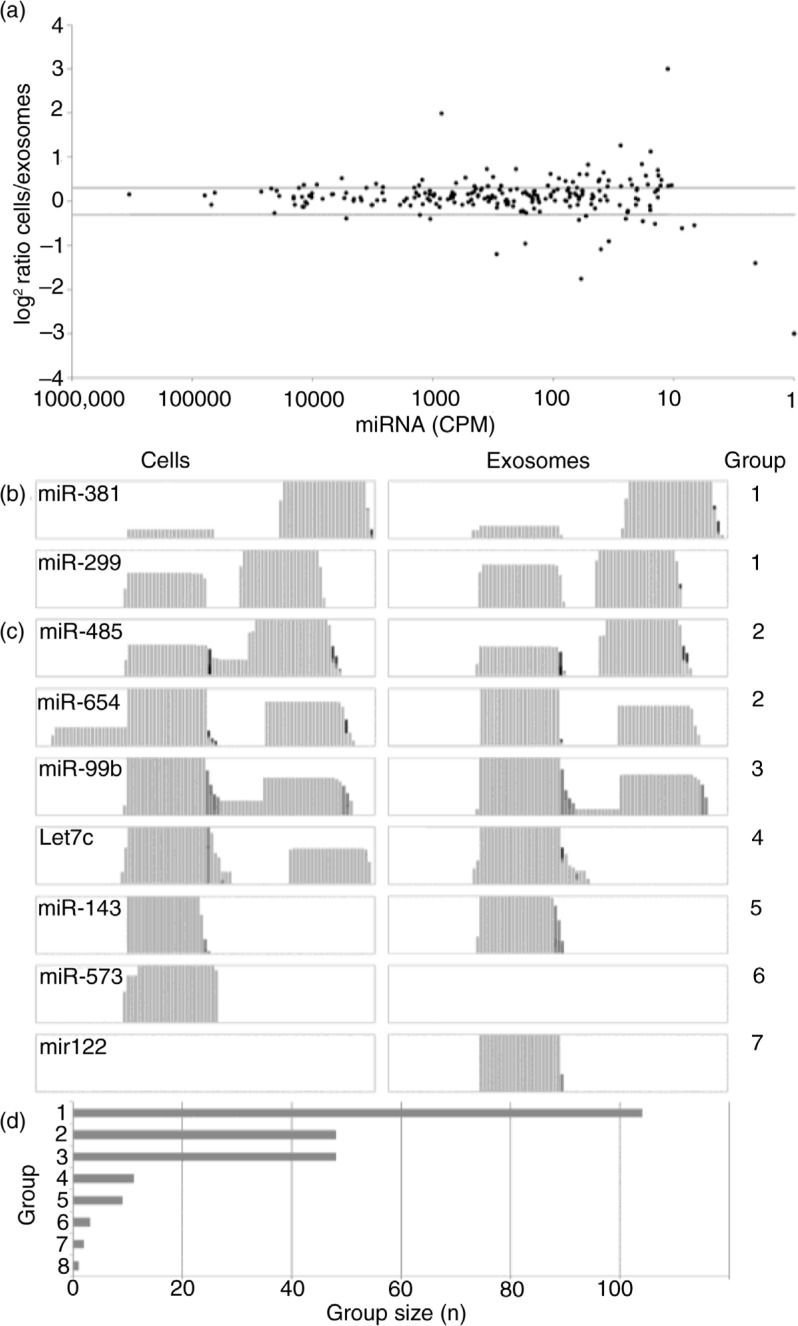
Fig. 2.
Distribution of micro RNAs (miRNAs) in cells and exosomes. (a) Log2 miRNA abundance ratios (cells/exosomes) are displayed with miRNAs ordered by their abundance (CPM). Horizontal grey lines indicate ±1.5-fold ratios. Differences in distribution of miRNA fragments between cells and exosomes as observed in Integrative Genomics Viewer coverage tracks were grouped as follows: (b) group 1: similar distribution; (c) group 2: additional fragment observed in cells; group 3: additional fragment present in both cells and exosomes; group 4: one fragment not observed in exosomes; group 5: only one fragment observed in both cells and exosomes; group 6: miRNA not detected in exosomes and group 7: miRNA not observed in cells. Group 8 encompasses miRNAs not fitting any of the described groups and consists of only 2 miRNAs. All groups are illustrated by representative miRNAs (y-axis in log scale). Comparison of group sizes (d) shows that most miRNA are distributed in a similar manner in cells and exosomes.

