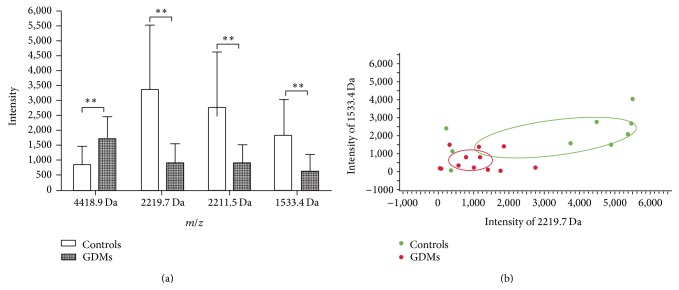
Figure 3.
(a) Column view of the mass spectra from the two groups, showing that the peak intensity at 2219.7, 2211.5, and 1533.4 Da of GDMs is significantly lower, whereas the intensity at 4418.9 Da of GDMs increased evidently (** P < 0.01). (b) Scatter plots of the GDMs (red dot) and controls (green dot) established by the combination of peptides 2219.7 and 1533.4 Da, showing a well-discriminated fitting shape of the curve.

