
Fig. 2.
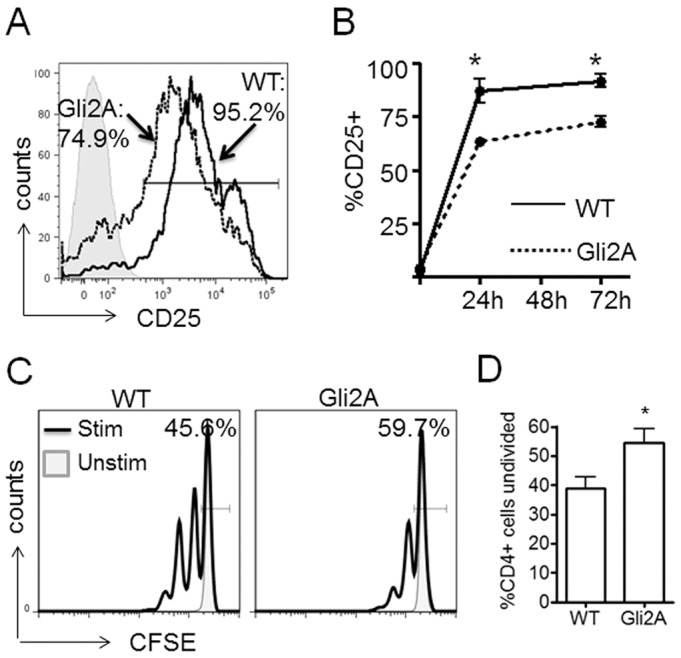
Gli2-mediated transcription attenuates T-cell activation kinetics. (A,B) Gli2A and WT splenocytes were cultured with 0.01 μg/ml anti-CD3/CD28 for three days. Cells were stained with anti-CD25 and anti-CD4 antibody. (A) Expression of CD25 on CD4+ cells after 3 days. Histograms show the percentage of CD25+ cells in WT (solid line) and Gli2A (dotted line). (B) Chart shows the percentage (mean±s.e.m.) of CD4+ T-cells that express cell-surface CD25 (n=3 mice per group, *P<0.05). (C) CD4+ cell division measured by CFSE dilution at 72 h after activation with anti-CD3/CD28. Histogram bar and label shows the percentage of cells that had not divided. (D) Percentage (mean±s.e.m.) of CD4+ cells that had not divided after 72 h in WT and Gli2A activation cultures, n=4, *P=0.04.