Fig. 3.
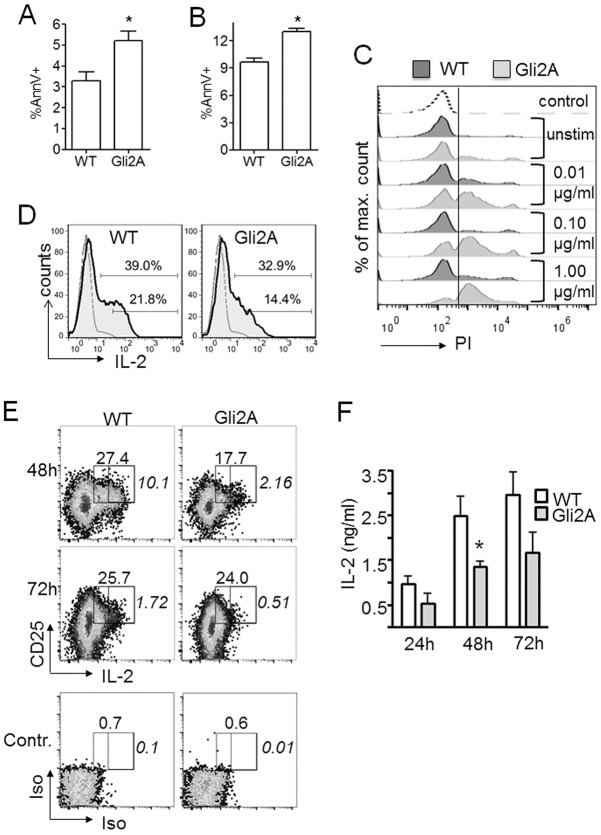
Gli2A-driven transcription enhances apoptosis and impairs IL-2-responsiveness during division. (A) Percentage (mean±s.e.m.) of CD4+ AnnV+ (early apoptotic cells) as determined by live gating from splenocyte activation cultures (24 h, n=5 experiments, *P=0.02) and (B) percentage of CD4+ AnnV+ cells in unstimulated cultures (72 h, n=3, *P=0.02). (C) Propidium iodide (PI) staining of CD4+ splenocytes at 24 h after stimulation with anti-CD3/CD28 (0, 0.01, 0.1 or 1.0 µg/ml; 0, unstimulated). Histograms are representative of two experiments. Dotted, background staining; dark-grey, WT; light-grey, Gli2A. (D) Intracellular IL-2 staining in fresh CD4+ splenocytes following 3 h activation with PMA (50 ng/ml), ionomycin (500 ng/ml) and Brefeldin A (2 ng/ml). Bars on shaded histograms show the percentage of IL-2+ and IL-2hi cells, gated on CD4+ cells; the dashed grey line shows background staining. A representative example from five experiments is shown (IL-2hi, WT, 25.0%±0.6, Gli2A: 19.9±1.5, P=0.009). (E) Purified CD4+ cells were cultured with anti-CD3/CD28-coated beads for up to 3 days. Surface CD25 and intracellular IL-2 were measured by flow cytometry at the times indicated, the percentage of CD25+ IL-2+ cells (large gate) and CD25+ IL-2hi cells (smaller gate, labelled in italic numerals). Gates were set according to isotype control staining of CD4+ cells (lower panels). Results are representative of three experiments (n=3, WT versus Gli2A percentage for CD25+ IL-2+ cells at the 48 h time-point, P<0.01 compared with WT). (F) ELISA showing mean±s.e.m. IL-2 produced by purified CD4+ cells cultured with anti-CD3/CD28-coated beads (WT, n=5; Gli2A, n=4). *P=0.04.

