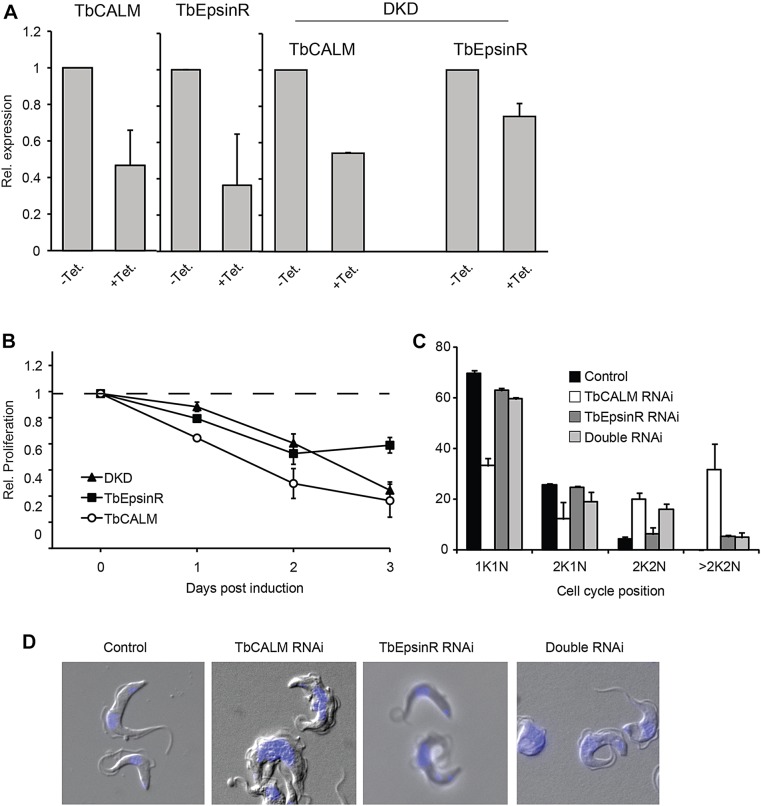
Fig. 5.
Proliferative and morphological defects following TbCALM and TbEpsinR depletion. (A) qRT-PCR analysis of TbCALM and TbEpsinR mRNA expression following 48 h of RNAi induction (+Tet.) in single marker bloodstream-form cells harbouring RNAi constructs targeting either TbCALM, TbEpsinR or both TbCALM and TbEpinR together (DKD). mRNA levels, normalised to β-tubulin, are expressed as relative expression compared to non-induced cells. Data are expressed as mean±s.e.m. from three independent inductions. (B) Proliferation rate of RNAi-induced cells normalised to non-induced cells. Data are mean±s.e.m. from three independent inductions. (C) Cell cycle analysis following 48 h of RNAi induction. xK, number of kinetoplasts; yN, number of nuclei. Control is a parental cell line, shown as black bars; TbCALM RNAi is shown as white bars; TbEpsinR RNAi is dark grey bars; double RNAi is light-grey bars. Data are mean±s.d. from two independent inductions with at least 100 cells counted per specimen per induction. (D) Morphology following depletion of TbCALM and/or TbEpsinR. DIC images of cells after 48 h of RNAi induction; DNA is stained with DAPI (blue).

