Figure 4.

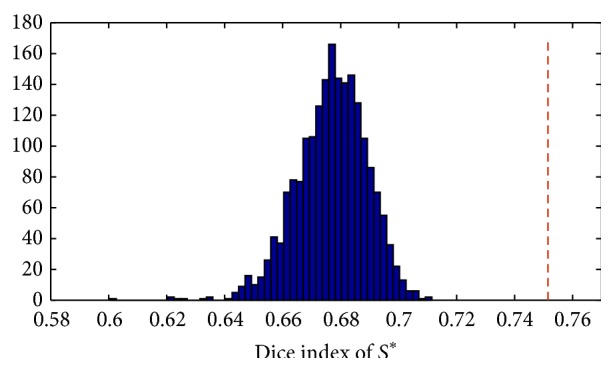
Distribution of 2000 random Dice values compared with true Dice (shown with the dashed red line) concerning 36 features obtained by the sequential forward selection.

Distribution of 2000 random Dice values compared with true Dice (shown with the dashed red line) concerning 36 features obtained by the sequential forward selection.