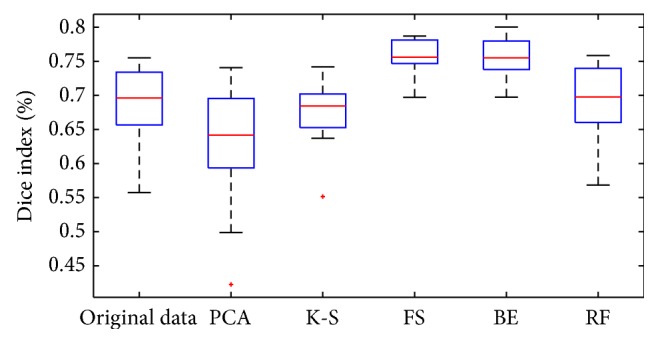
Figure 5.

Dice index comparison for the following methods: original dataset (315 for each voxel); PCA (197 selected features); K-S test (57 selected features); SFS (36 selected features); SBE (23 selected features); Random Forest (222 selected features). Boxes have lines at the lower quartile, median, and upper quartile values, with whiskers extending to 1.5 times the interquartile range. Outliers are indicated by a plus sign.
