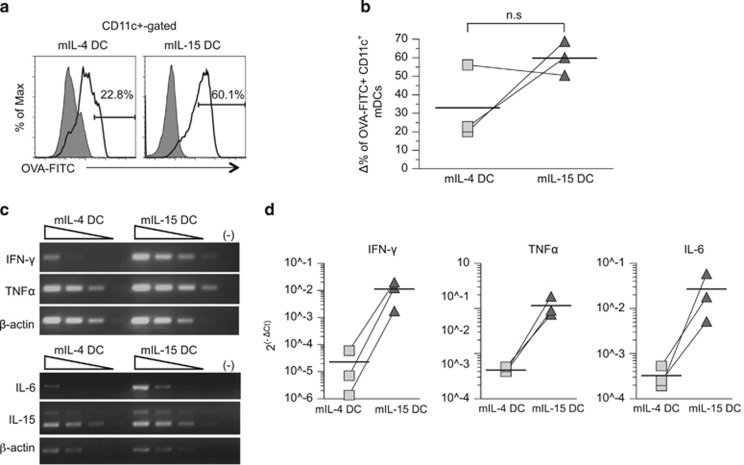
Figure 2.
Increased Ag uptake function with prominent increases in inflammatory cytokine production of IL-15 DCs. (a and b) Comparison of Ag uptake functions of mIL-4 DCs versus mIL-15 DCs. mDCs were incubated with 10 μg ml−1 OVA-DQ for 30 min at 37 °C, or at 4 °C as control, and stained with anti-CD11c Ab and analyzed by flow cytometry. Line and shaded gray histogram graphs indicate incubation with OVA-DQ at 37 and 4 °C, respectively. The OVA uptake was calculated by subtracting the percentage of CD11c+ mDCs that nonspecifically internalized OVA-DQ at 4 °C from that at 37 °C. The Δ% values of OVA+/CD11c+ mDCs from three matched donors were compared and the average percentage values were illustrated by horizontal bars. (c) Semiquantitative RT-PCR of IFN-γ, TNFα, IL-6, IL-15 and β-actin in mDCs. cDNA generated from RNAs pooled from three donors was serially diluted at 0, 1:10, 1:100 and 1:1000 for analysis. (d) Quantitative SYBR green RT-PCR of IFN-γ, TNFα and IL-6 gene levels in imDCs and mDCs. cDNAs pooled from three donors were analyzed. Relative cytokine gene expression was normalized with β-actin expression and the average percentage values illustrated by horizontal bars. Donor-paired specimens are shown by a line connection.

