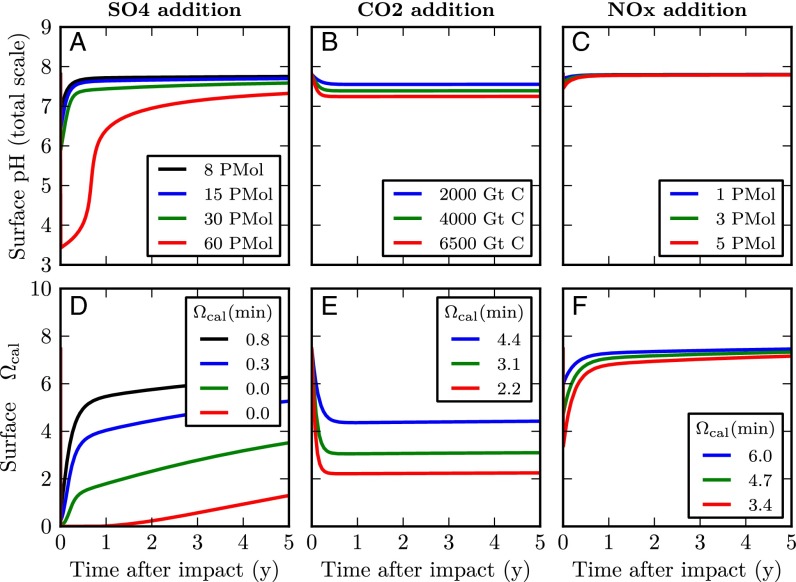
Fig. 2.
Impacts of very rapid additions (e-folding time of 10 h, ref. 14) of H2SO4 (A and D), CO2 (B and E), and HNO3 (C and F) on pH (A–C) and saturation state for calcite (D–F). Minimum Ωcalcite values for each model run are shown in the boxes. The color of each line indicates the magnitude of the forcing for that run. The axis scale for pH differs from that in Fig. 1.

