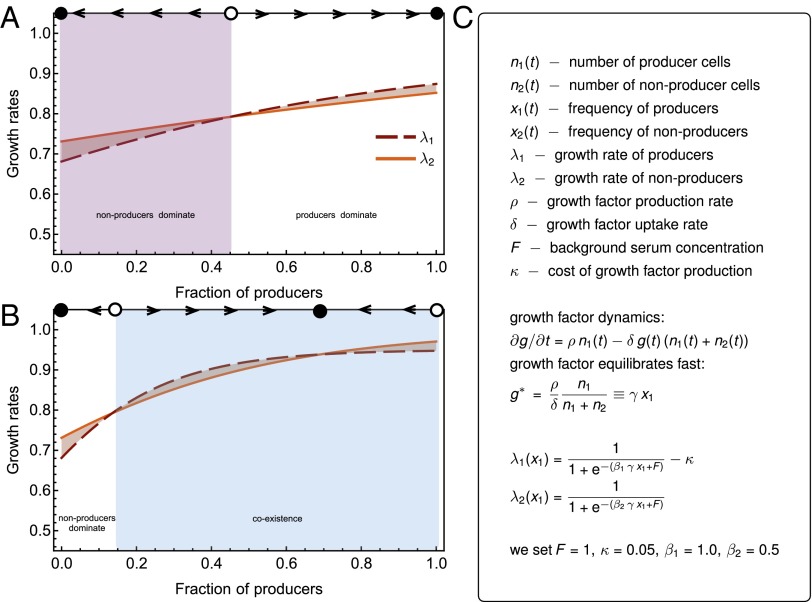
Fig. 1.
An illustration of the effect of differential growth rates between cancer cell phenotypes in the presence of a shared good that enhances growth. Type 1 produces and consumes a share good. Type 2 only consumes the shared good. (A) Growth rates of producers (dashed) and nonproducers (solid) when production of the shared good is only marginally higher than its rate of uptake, γ = 1.5. (B) Growth rates of producers and nonproducers when production of the shared good is five times higher than its rate of uptake, γ = 5.0. In both A and B, at the top, we show the direction of selection, with stable equilibria as full circles. (C) Mathematical model of two growing populations consuming a shared good, definitions, and equations. In this example we assume that the growth factor equilibrates fast. We do not need to assume any complex interaction patterns sometimes required by a nonlinear public goods game with population assortment. The critical parameter is the ratio of growth rate production rate over growth rate consumption rate, γ = ρ/δ. Its value determines whether the system has one unstable internal equilibrium, or two internal equilibria (one stable and one unstable).

