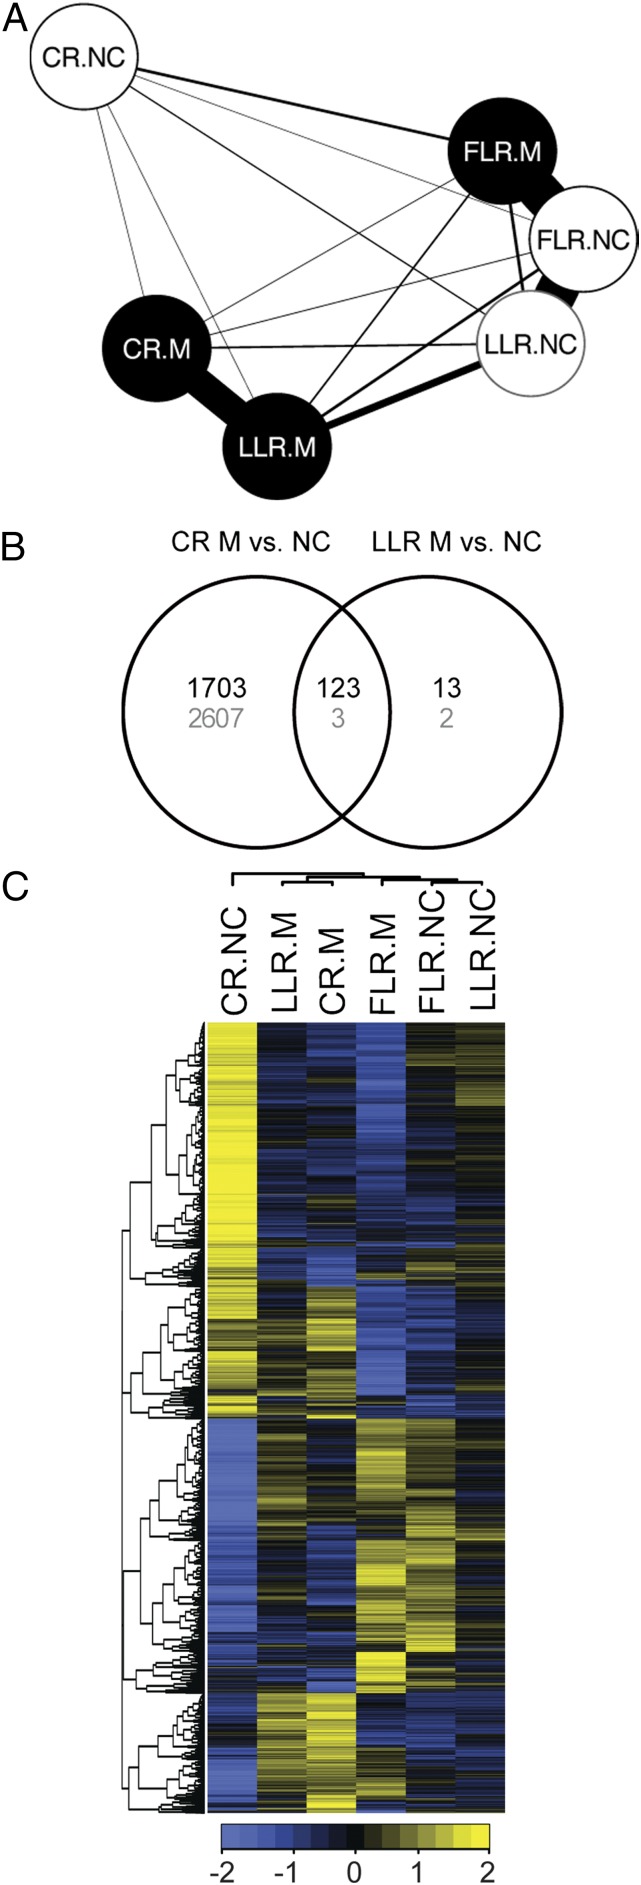
Fig. 2.
Similarity among gene expression profiles of colonized and noncolonized rice root types. (A) Network representation of the number of differentially expressed genes (FDR 10%) between each type of sample (CR, crown roots; LLR, large lateral roots; FLR, fine lateral root; open circles, noncolonized; filled circles, mycorrhizal). Line width is inversely proportional to the number of significantly changing genes. (B) Number of genes that are significantly (FDR 10%) up- (black) or down-regulated (gray) in CRs or LLRs upon AM colonization. At FDR 10%, no gene was significantly regulated in FLRs. (C) Relative expression (scale bar, Z-scale of SDs from the cross-sample mean; blue, below the mean; yellow, above the mean) of the 8,980 differentially expressed genes (FDR 10%) in each sample. NC, noncolonized; M, mycorrhizal; root types as in A. Both genes and samples are clustered hierarchically. A large group of genes was distinguished by high relative expression in noncolonized crown roots (CR.NC).

