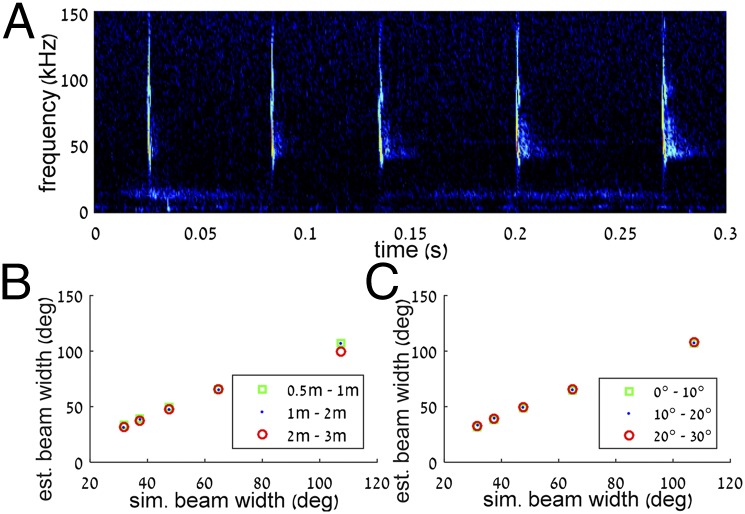
Fig. 4.
Audio analysis and beam reconstruction. (A) A typical recording (spectrogram) including five calls of an approaching bat. (B) Simulations of beam reconstruction for bats at different distances from the array. This range of distances represented the range of distances that we analyzed in the real data. (C) Simulation of beam reconstruction for different angles toward the array. This range of angles represented the range of angles that we analyzed in the real data.

