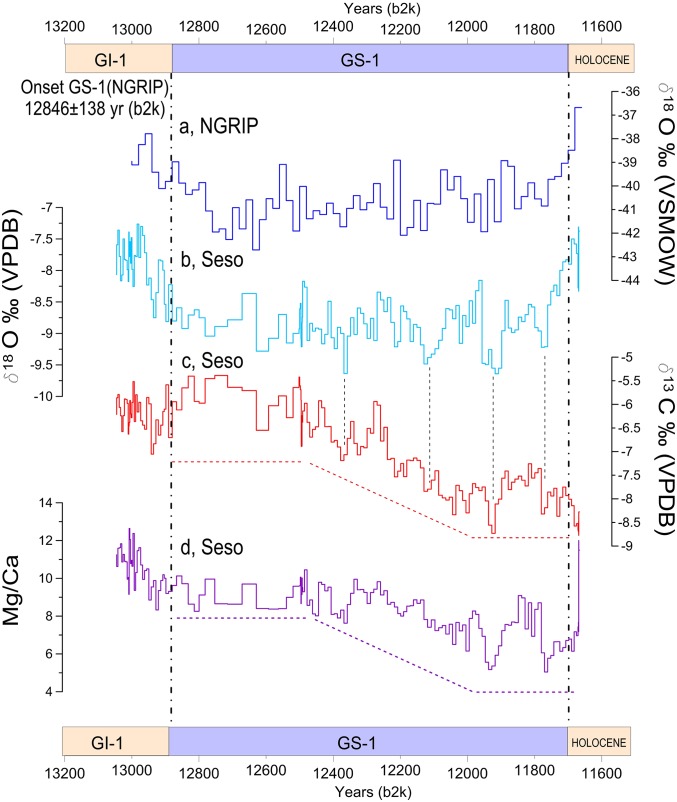
Fig. 2.
Temperature and hydrological variability reconstructions during GS-1 from Seso stalagmite SE09-6. (A) NGRIP δ18O [‰ VSMOW (Vienna standard mean ocean water)] Greenland record (1). (B) The δ18O [VPDB (Vienna Pee Dee Belemnite)], (C) δ13C (VPDB), and (D) Mg/Ca profiles from SE09-6 stalagmite. Black lines indicate different trends among NGRIP and Seso δ18O records after 12,500 y b2k. Black dashed lines mark similar responses in δ18O and δ13C from SE09-6 in late GS-1. Red and violet dashed lines indicate the three phases observed in δ13C and Mg/Ca profiles from SE09-6 stalagmite.

