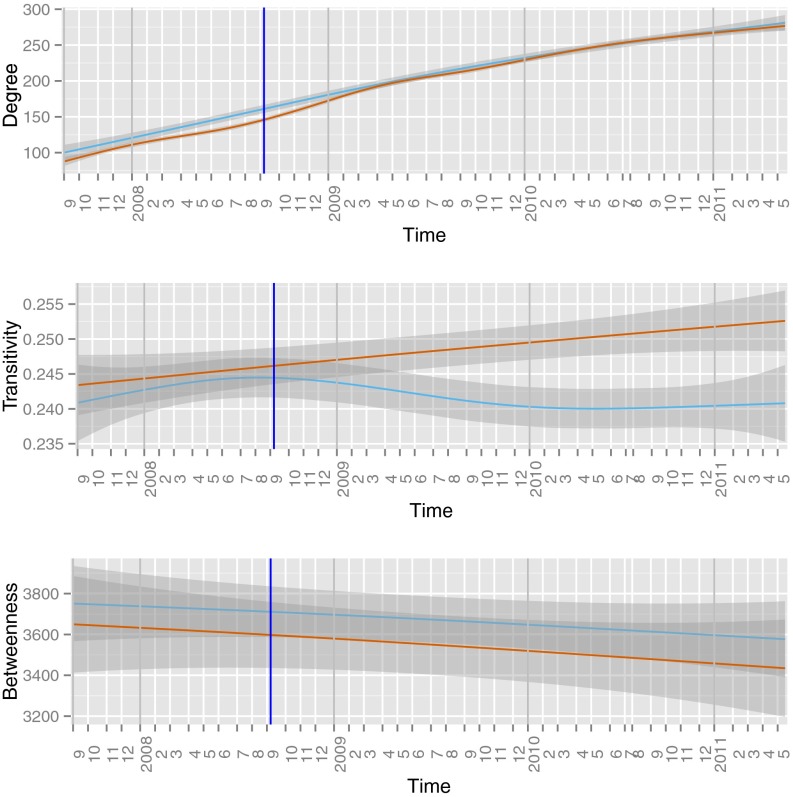
Fig. 2.
We plot estimated outcomes (average degree in Top, transitivity in Middle, and average betweenness centrality in Bottom) for 64,957 students who attended 5 universities affected by the hurricane (treatment group; red) and 10 universities not affected by the hurricane (control group; blue) over a period of 192 wk (54 wk before the hurricane and 138 wk after the hurricane). The solid curves were fitted using locally weighted scatterplot smoothing, and the shaded gray regions show the 95% confidence bands for these curves. Hurricane Ike made landfall during week 0, which is marked by the blue vertical line. Details are in the text.

