Fig. 1.
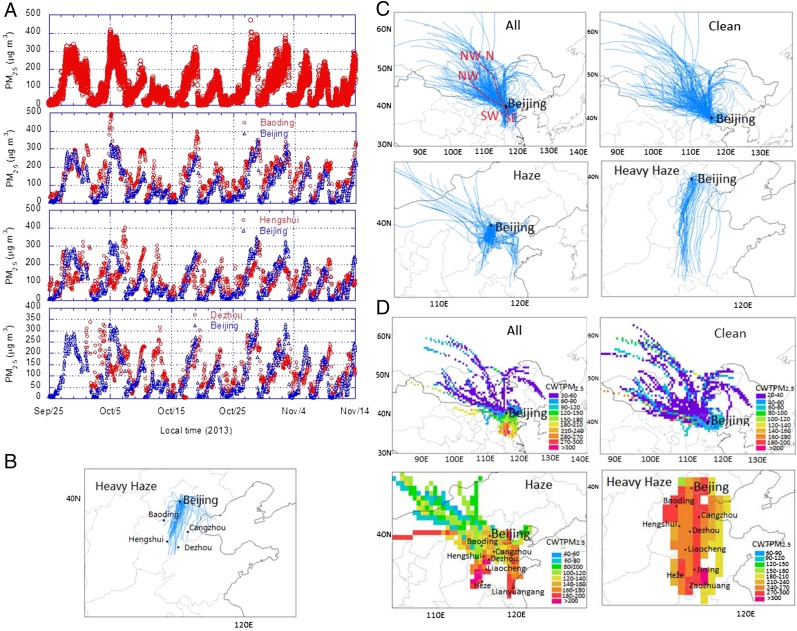
(A) Time series of hourly concentrations of observed PM2.5 at 10 sites [Wanshouxigong (39.87°N, 116.37°E), Changpingzhen (40.20°N, 116.23°E), Nongzhanguan (39.97°N,116.47°E), Tiantan (39.87°N,116.43°E), Guanyuan (39.94°N,116.36°E), Haidianquwanliu (39.99°N,116.315°E), Dongsi (39.95°N, 116.43°E), Gucheng(39.93°N,116.23°E), Shunyixincheng (40.1438°N, 116.72°E), and Aotizhongxin (40.00°N, 116.41°E)] in Beijing (www.cnemc.cn/publish/106/0536/newList_1.html). Temporal evolution of hourly PM2.5 mass concentrations is found to be the same as those in figure 1 of Guo et al. (1). Comparisons of observed daily mean PM2.5 between Beijing and other cities (Baoding, Hengshui, and Dezhou, which are reachable within 24 h by the air masses) are also shown. (B) All 24-h air mass back trajectories for the heavy haze periods (PM2.5 ≥ 200 μg/m3) calculated with the National Oceanic and Atmospheric Administration HYSPLIT model (ready.arl.noaa.gov/HYSPLIT.php) on the basis of the same meteorological data as Guo et al. (1). The mean wind speed is 2.36 m/s and the mean transport distance in 24-h is 204 km during the heavy haze periods. (C) Cluster analysis of the 48-h air mass back trajectories starting at 100 m in Beijing. All back trajectories for the whole period, relatively clean cases (PM2.5 < 75 μg/m3), haze cases (PM2.5 ≥ 75 μg/m3 but PM2.5 < 200 μg/m3), and heavy haze case (PM2.5 ≥ 200 μg/m3) are shown. Four transport pathways (clusters) are determined: SE (SouthEast), SW (SouthWest), NW (Northwest), and NW-W (Northwest-West). (D) Concentration-weighted trajectory (CWT) maps for PM2.5 for the whole, relatively clean, haze, and heavy haze cases on the basis of observations shown in A. A high CWT value implies that air parcels traveling over the grid cell would be associated with high polluted value at the receptor site. The studying period is from September 25 to November 14, 2013.

