
Fig. 2.
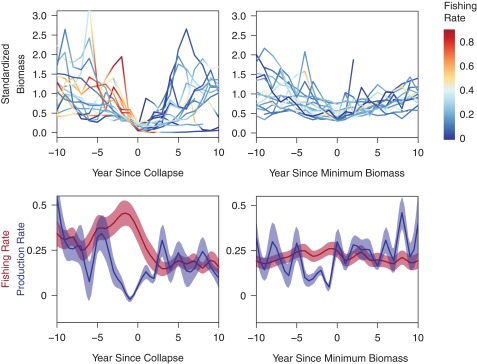
(Upper) Time trends of population biomass and fishing rate (Left) before and after population collapse and (Right) before and after minimum biomass for populations that did not collapse. High fishing rates (>60% of population biomass removed by fishing annually) were not uncommon in collapsed populations before stock collapse but were less common among noncollapsed populations. For collapsed stocks, fishing rates were commonly reduced after collapse. (Lower) Mean (± SE) fishing rate and natural population production rate (Left; surplus production standardized by each population’s average biomass) before and after population collapses and (Right) before and after minimum biomass for populations that did not collapse. On average, collapsed stocks experienced high fishing rates for several years before collapse, and stock productivity consistently declined sharply 1–2 y before stock collapse. Extreme fishing rates and extreme drops in natural population productivity were less common among stocks that did not collapse. To stabilize variance in productivity, we took the average and SE after omitting the smallest and largest values for each year.