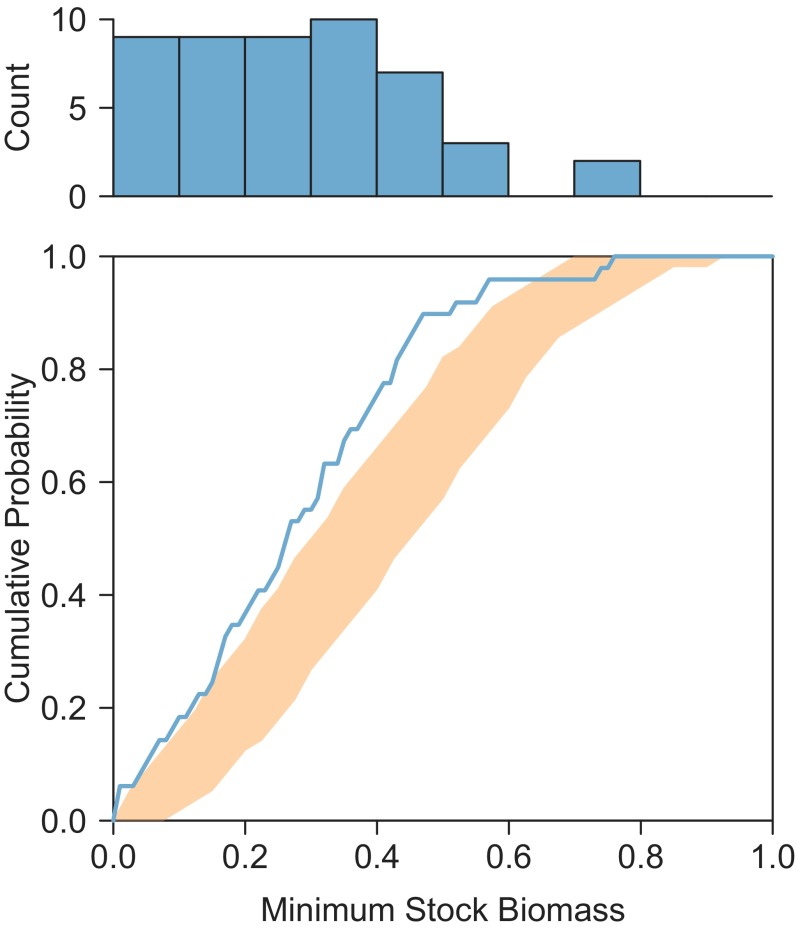
Fig. 3.
Comparison of minimum stock biomass levels (shown as a histogram in Upper and a cumulative frequency distribution line in blue in Lower), with expected 95% range of cumulative frequency distribution (orange) from randomization test. The randomization test simulated populations with similar characteristics (time series lengths, variability, and spectral scaling of population growth rate) but without any long-term trend in abundance. The observed frequencies of very low minimum biomass levels are greater than expected if populations were fluctuating randomly.

