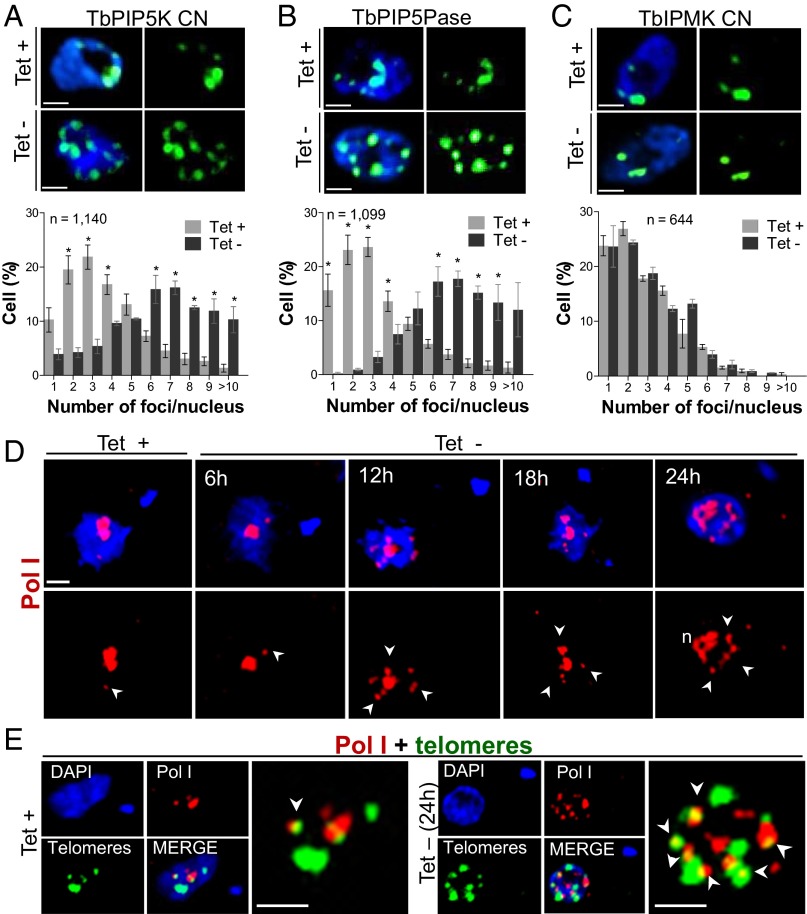
Fig. 3.
Effect of TbPIP5K and TbPIP5Pase knockdown on the number of telomeric and Pol I foci. (A–C) FISH analysis with the PNA-(CCCTAA)3-FITC probe for telomeres after 24 h knockdown of TbPIP5K, TbPIP5Pase or TbIPMK expression; tet +, 0.5 µg/mL. Quantification of telomeric foci per nucleus are shown below the images. See also Fig. S4. (D) IF analysis of Pol I foci after conditional knockdown of TbPIP5Pase. (E) Pol I and telomeric foci 24 h after knockdown of TbPIP5Pase. Pol I was detected with Mab 16B1a (8) followed by anti–IgG-AlexaFluor 594 (red), telomeres with a FITC-conjugated PNA-(CCCTAA)3 probe (green), and DNA stained with DAPI (blue). Arrowheads indicate regions of Pol I foci (D) or Pol I and telomeric foci colocalization (E). Data in A–C are the means (SEM) of three experiments. *Significance at P < 0.05. (Scale bar, 1 µm.)

