Fig. 3.
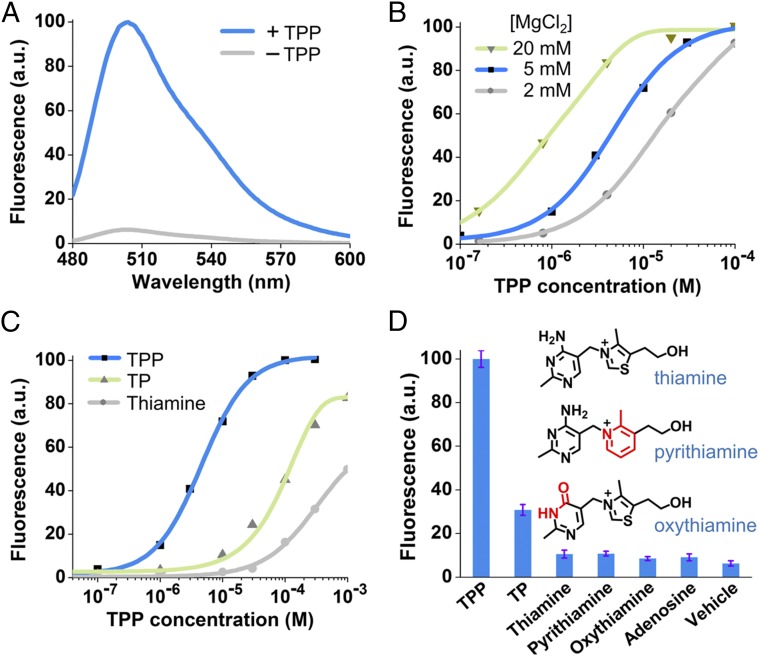
In vitro characterization of the Spinach riboswitch. (A) Fluorescence emission spectra of the Spinach riboswitch in the presence or absence of TPP. Spectra were measured in a solution containing 100 nM RNA, 10 µM DFHBI, and either 0 or 100 µM TPP. (B) Dose–response curve for fluorescence detection of TPP by the Spinach riboswitch at different concentrations of MgCl2. The maximum fluorescence signal of the Spinach riboswitch at each concentration of MgCl2 was set to 100. Half-maximal fluorescence is reached at 9.0 µM, 4.4 µM, and 0.77 µM TPP at 2 mM (gray), 5 mM (blue), and 20 mM (green) concentrations of MgCl2, respectively. The EC50 of the Spinach riboswitch is influenced by magnesium concentration, as is consistent with the known effect of magnesium on the binding affinity of the TPP riboswitch (32). In live-cell experiments, 2 mM MgCl2 was used to image TPP Spinach riboswitch fluorescence because 2 mM represents a physiological magnesium level often seen in bacterial cells (Fig. S4D) (59). (C) Dose–response curve for fluorescence activation of the TPP Spinach riboswitch by TPP and TPP analogs. Half-maximal fluorescence is reached at 4.4 µM TPP (blue). The dose–response curves for thiamine (gray) and thiamine monophosphate (TP, green) were measured also; half-maximal fluorescence is reached at 955 µM and 116 µM, respectively. The Spinach riboswitch is highly specific for TPP but also is activated by thiamine monophosphate or thiamine, as is consistent with the known binding specificity of the TPP riboswitch (32). (D) Selectivity of the Spinach riboswitch. Fluorescence emission was measured in the presence of 30 µM of the indicated compounds. Shown are mean and SEM values of three independent replicates. Chemical structures of pyrithiamine and oxythiamine are drawn with differences from thiamine indicated in red.

