Fig. 3.

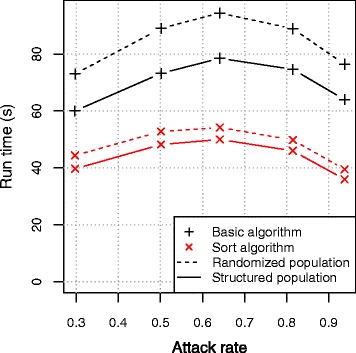
Run time according to attack rate and population structure for Nassau simulations using FRED. Structured population: sorted according to day cluster (first) and household (second).

Run time according to attack rate and population structure for Nassau simulations using FRED. Structured population: sorted according to day cluster (first) and household (second).