
Fig. 3.
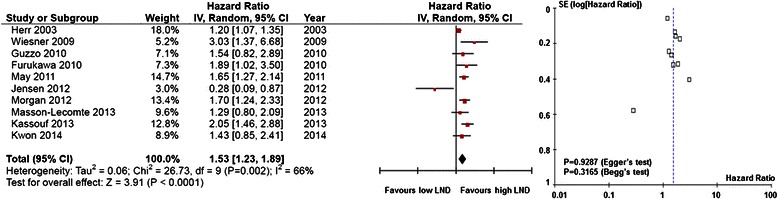
Forest plots of disease-specific survival by lymph node density. (Left) The horizontal lines correspond to the study-specific hazard ratio (HR) and 95 % confidence interval (CI), respectively. The area of the squares reflects the study-specific weight. The diamond represents the pooled results of HR and 95 % CI. (Right) The Begg test funnel plots for publication bias. Each point represents a separate study of the indicated association. The vertical line represents the mean effects size.