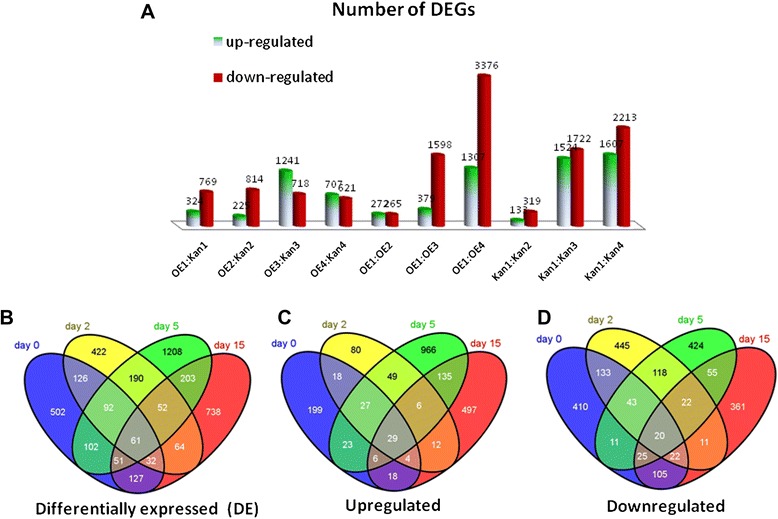
Figure 2.

Regulation of differentially expressed genes among inoculated, noninoculated of mj-far-1 overexpressing and control roots. (A) Comparison of differentially regulated genes from RNA-Seq data between tomato root lines at each designated time point. Numbers of up- and downregulated genes are indicated from 10 comparisons. (B) A generalized Venn diagram showing intersection of genes that are differentially regulated (up- and downregulated) in mj-far1.1 root line compared with vector 11.5 control roots among noninoculated, 2, 5, and 15 DAI samples. (C) Intersection of genes that are upregulated in the mj-far1.1 root line compared with vector 11.5 control roots among noninoculated, 2, 5, and 15 DAI samples. (D) Intersection of genes that are downregulated in mj-far1.1 root line compared with vector 11.5 control roots among noninoculated, 2, 5, and 15 DAI samples. Genes present in two sets are shown in the intersection, so that the sum of the numbers within a circle is the total number of genes in that set. The size of the circles is not representative of the quantity of probe sets. Overlapping areas represent common probe sets. Fold change with an absolute value >2 and P value ≤ 0.05 was used for the analyses.
