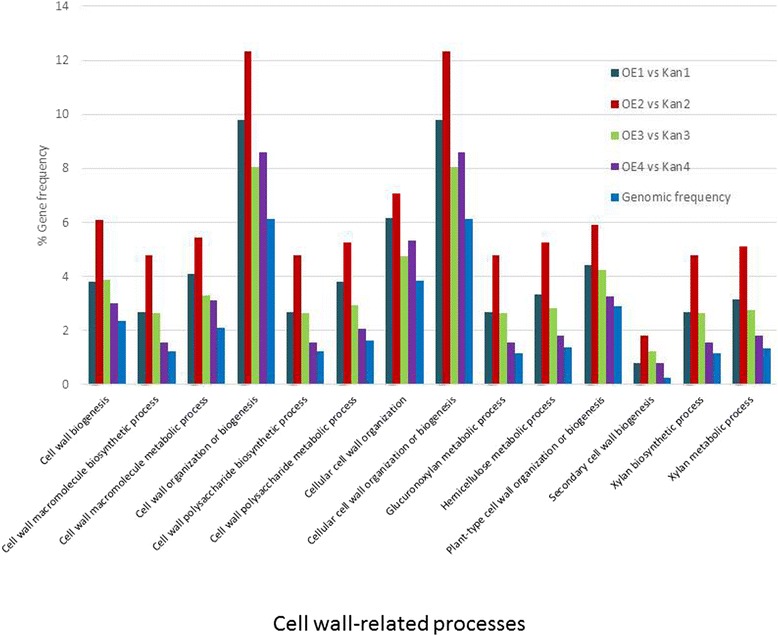
Figure 6.

Frequency distribution of reads putatively associated with cell wall processes identified among differentially expressed genes (DEGs) from the root transcriptomes of all noninfected and infected samples. All Kan roots are root samples of vector 11.5 carrying the kanamycin-resistance gene (Kan1, Kan2, Kan3, and Kan4 refer to Kan control roots that were noninoculated and at 2, 5, and 15 DAI, respectively) and OE roots are mj-far-1.1 lines overexpressing mj-far-1 (OE1, OE2, OE3, and OE4 refer to OE roots that were noninoculated and at 2, 5, and 15 DAI, respectively). Each category of cell wall-related genes is indicated on the x-axis and the percentage of genes in each category relative to the ITAG2.3 reference tomato genome and the DEGs is indicated on the y-axis.
