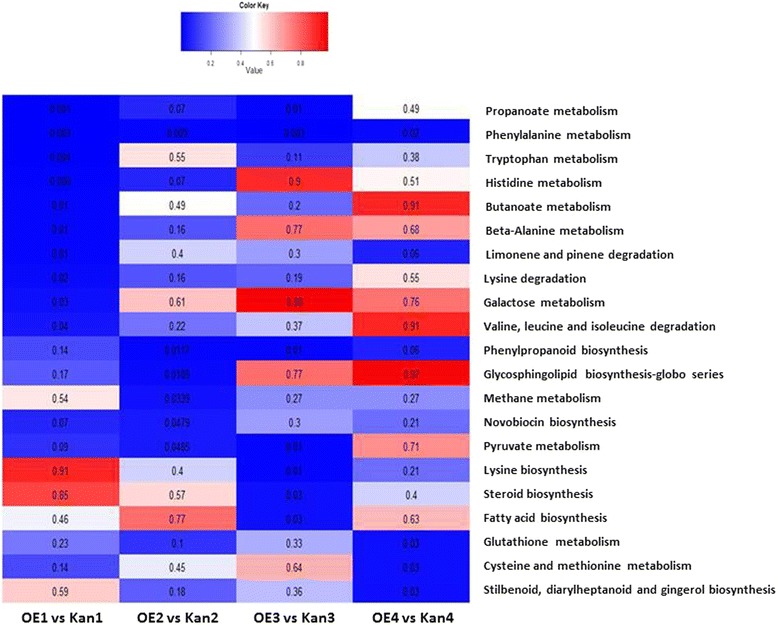
Figure 9.

Enriched KEGG pathway at different time points. All 3970 differentially expressed genes were assigned to a pathway according to the KEGG database. All Kan roots are root samples of vector 11.5 carrying the kanamycin-resistance gene (Kan1, Kan2, Kan3, and Kan4 refer to Kan control roots that were noninoculated and at 2, 5, and 15 DAI, respectively) and OE roots are mj-far-1.1 lines overexpressing mj-far-1 (OE1, OE2, OE3, and OE4 refer to OE roots that were noninoculated and at 2, 5, and 15 DAI, respectively). KEGG pathway enrichment at each time point was calculated using the hypergeometric test. The P-values are presented on the heat map: the color gradient from dark blue to red represents strongly and significantly enriched pathways to nonsignificantly enriched pathways, respectively.
