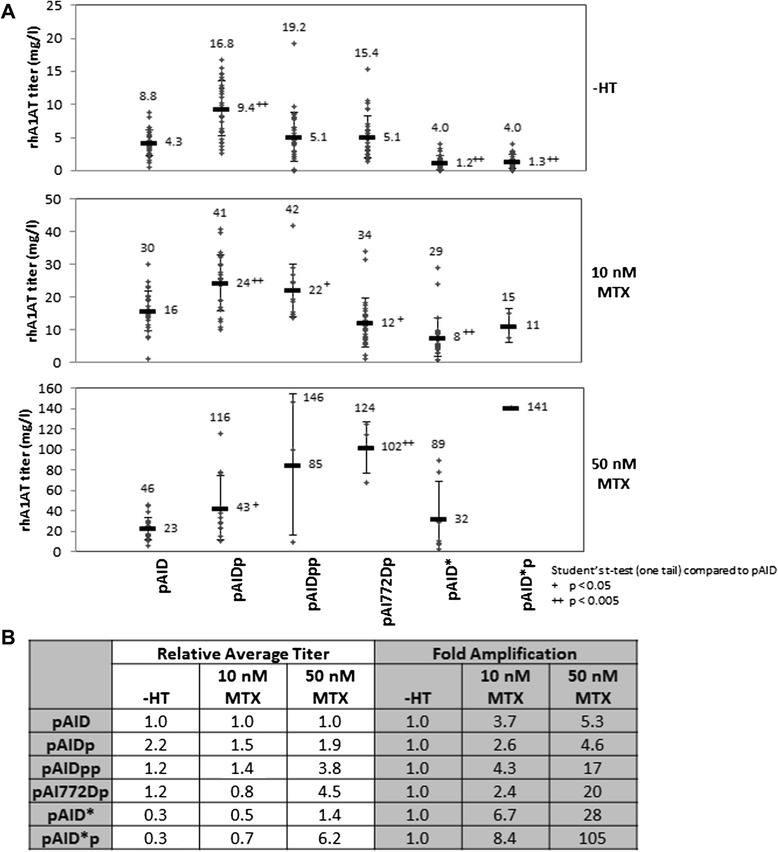
Figure 2.

Recombinant human A1AT titers of mini pools derived from different expression vectors in 96 well-plate cultures. Cells are seeded into 96 well plate and allowed to grow for 14 days with one change in culture medium at Day 7. Culture supernatant was then harvested for hA1AT ELISA to determine recombinant protein titer. (A) rhA1AT titers of each cell pool at different stages of selection and MTX amplification were plotted. Titers of the highest producing cell pool and the average titer of all analyzed cell pools were annotated on the graphs. The average titers of each vector set were compared to that of pAID at the same amplification stage and analyzed by one-tail Student’s t-test. Results of the analysis were annotated besides the average titers as + for p < 0.05 and ++ for p < 0.005. (B) Relative average titers and Fold amplification of the cell pools. Relative average titers of each set of cell pools were calculated by dividing the average titers with that of the pAID set. Fold amplification were calculated by dividing the average titers of each set of cell pools with that of the same cell pool set after –HT selection.
