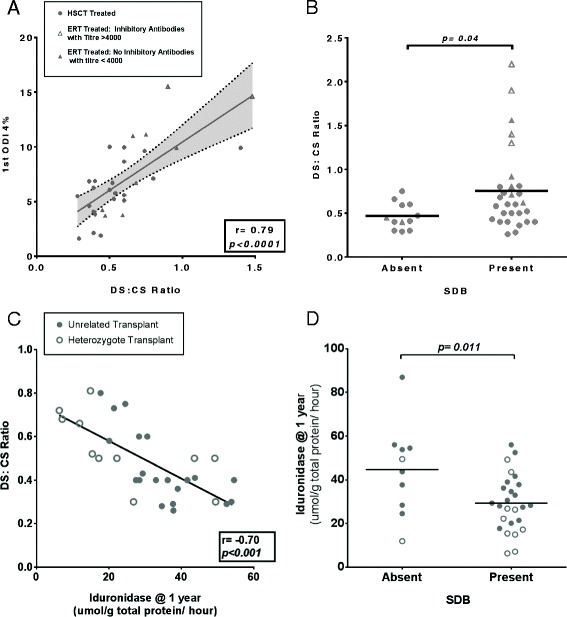
Figure 2.

Metabolic biomarkers of clinical outcome in MPS I. Substrate reduction, measured by DS:CS ratio, and delivered enzyme activity following HSCT correlate significantly with measures of sleep disordered breathing (SDB) amongst MPS I patients. Bars represent means with p values presented from Mann–Whitney U (Multivariate p values are presented in Table 3). For correlation plots, linear regression lines of best fit were drawn and correlation coefficients were calculated with Pearson’s r, with p values representing significantly non-zero lines of best fit. Hurler patients identified by circle legend and attenuated by triangles. Each individual point represents one patient. (A). The ODI4% from the first post treatment sleep study of each patient correlates strongly to urinary DS: CS ratio performed at an identical time point (sleep study and urine sample collected within 4 weeks). Pearson Correlation r = 0.79 (r2 = 0.68), p < 0.0001. (B). Mean urinary DS:CS ratio 1 year after treatment was significantly improved in individuals without SDB (mean 0.47, S.D 0.15), compared to those with SDB (mean 0.75, S.D 0.48, p = 0.04). Amongst ERT treated patients, patients with inhibitors drive worsening SDB. (C). Increasing iduronidase (IDUA) one year following transplant correlates significantly with improved DS:CS ratio at one year (r = −0.70, p < 0.001). (D). Iduronidase enzyme activity one year post transplant is significantly higher when SDB was absent (mean 44.69, S.D 20.8), compared to those where SDB was present (mean 29.33, S.D 12.9, p = 0.011). HSCT, Matched unrelated donor (MUD): closed circles. HSCT, Heterozygote donors: open circles. Attenuated patients on ERT without antibody response: closed triangles: Attenuated ERT patients with inhibitors: open triangles.
