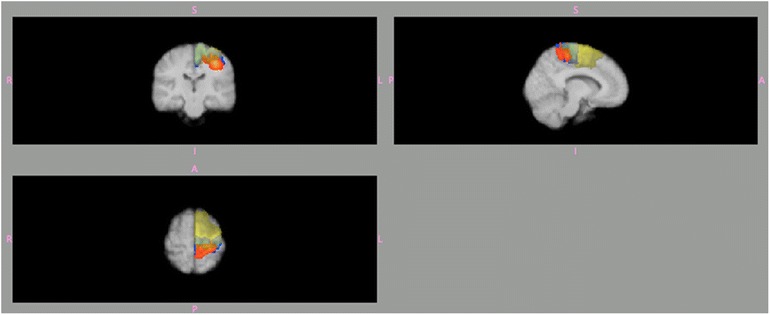
Figure 1.

Automatic definition of 3 Brodmann areas (BA) within the left hemisphere according to the Jülich probability atlas BA4a (blue), BA4p (orange) and BA6 (yellow). These areas are projected on to an averaged brain image from the 10 healthy subjects. Note the overlap, which is due to the inter-individual variability of the extension of these 3 areas.
